The Billing Dashboard, located within the Billing menu, presents a comprehensive overview of your billing data, making it easy for you to track and monitor your school's overall billing health at a glance.
The Dashboard is divided into two sections:
- Historical Percentages of Overdue
- Charged vs Collected
Who can access this feature?
Admin Account Types: System Admins, Admins, and Users
Permissions: Financial
In this article
Where to find the Billing Dashboard
The Billing Dashboard is located within the Billing menu at the top of the screen.
Important Notes
- Due to the large amount of data within this dashboard, it is anticipated that you may encounter slow loading times for the page.
- Currently, accounts never become inactive within the system, which means that the data within this report displays for both active and inactive accounts. However, a new feature will soon be launched to address this. Once this feature is implemented, the reporting logic in this report will be adjusted to only calculate data from active accounts.
Historical Percentages of Overdue
This top section of the Billing Dashboard displays your school's overdue percentage by month within a graph.
- The Historical Percentages of Overdue graph displays 3 years of data which includes the current year and the past two years. Each year is represented with a unique color line.
- It exclusively presents historical data. For the current term, the line extends up to the previous month.
- Note the light blue line in the image below representing 2023. It was August 2023 at the time the snapshot was created, therefore, the 2023 line ends at July.
- Past due flags are set nightly. If an account becomes past due it may not be reflected until the next day. Amounts are updated every 10 minutes
Filtering and Hover Options
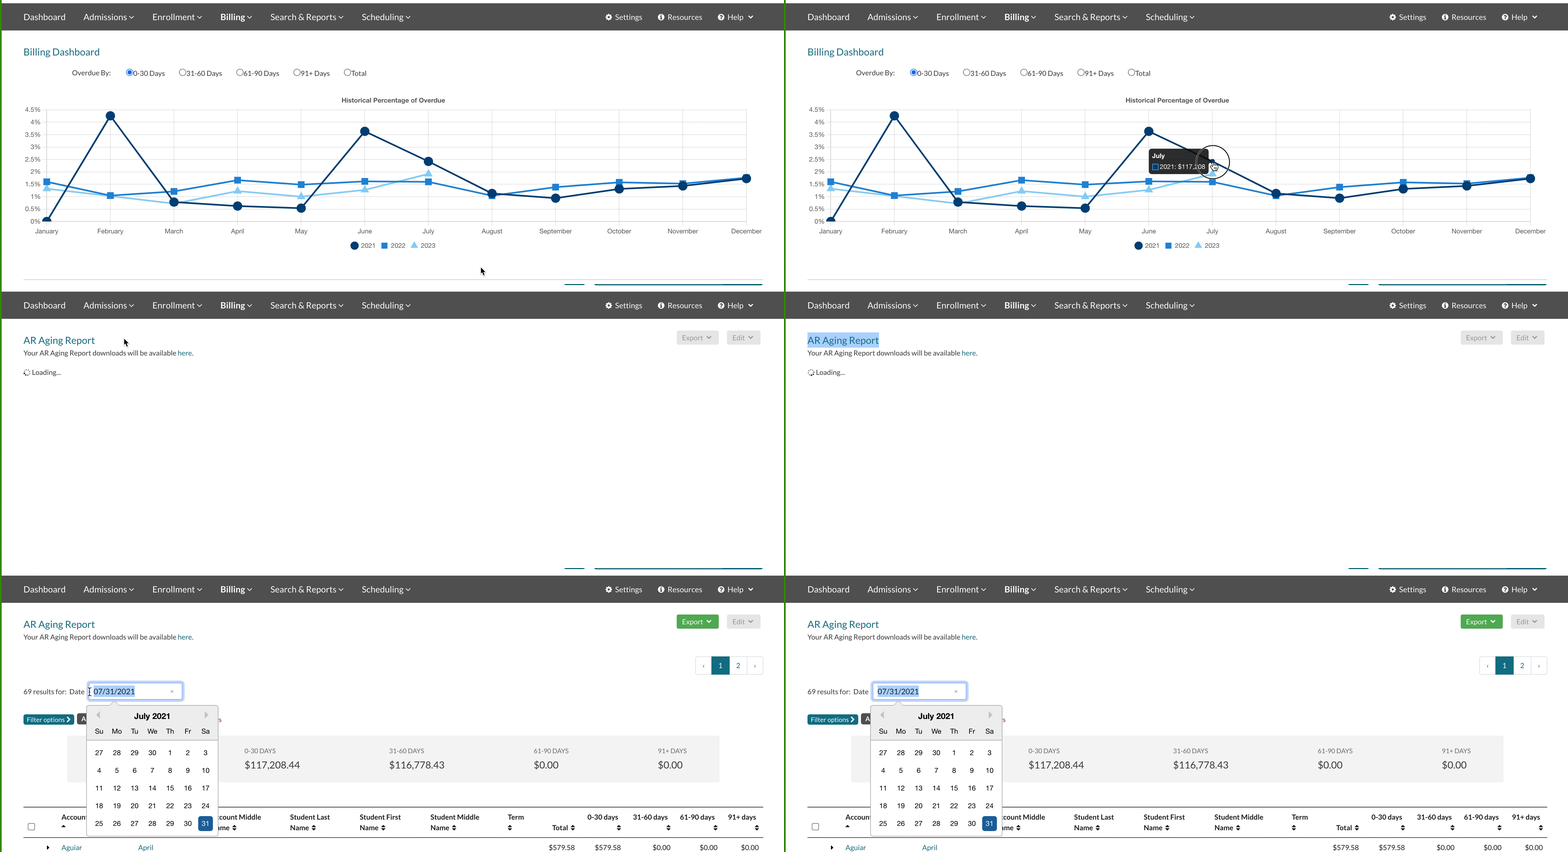
- Overdue By filter: Positioned above the graph, you have the option to filter based on the duration for which the amounts have been overdue: 0-30 days, 31-60 days, 61-90 days, 91+ days, or Total (to display all overdue amounts, irrespective of the duration).
-
Links to the AR Aging Report: Each bullet point within the graph links to the matching AR Aging report filtered by that month.
- Click on the icon point to navigate to the matching AR Aging report.
- Please note that you may also experience a slow load time while the AR Aging report calculates your selected filter.
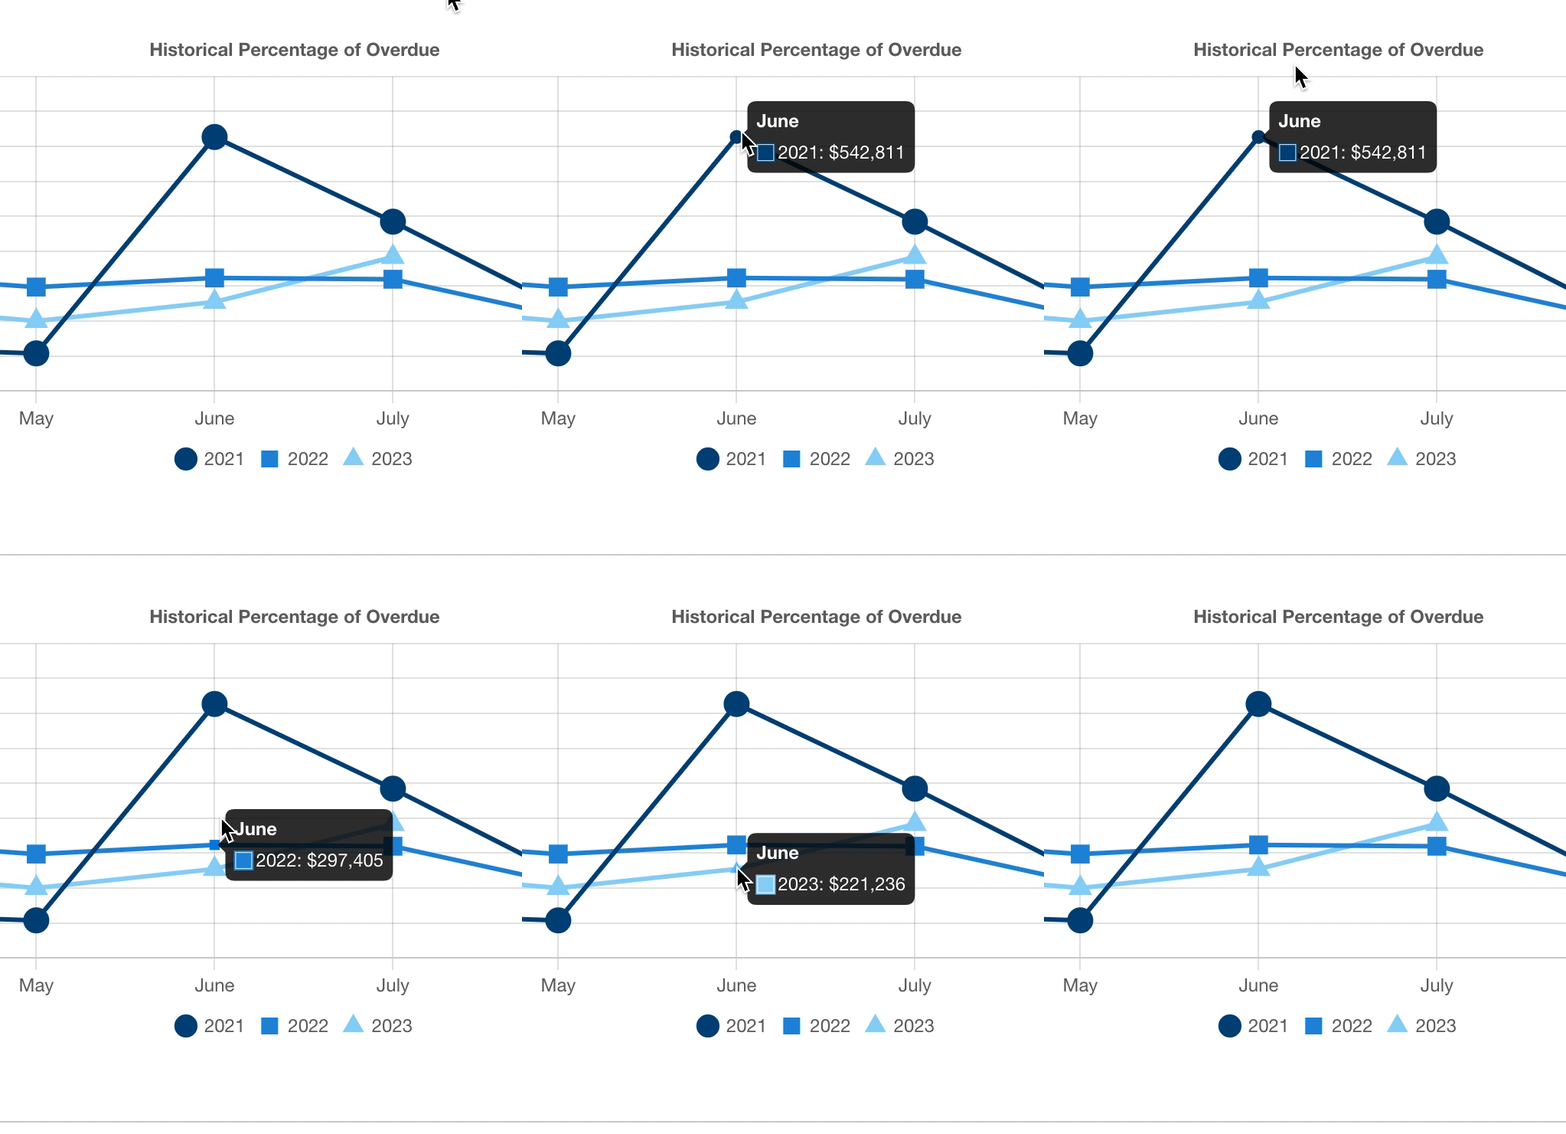
- Data while Hovering: When you place your cursor over any of the months along the line, the graph will reveal the total overdue amounts for that specific month.
-
Filter by Year: Within the graph, you have the ability to filter and display only selected terms.
- Choose one of the terms listed below the graph to exclude that specific dataset.
Charged vs Collected
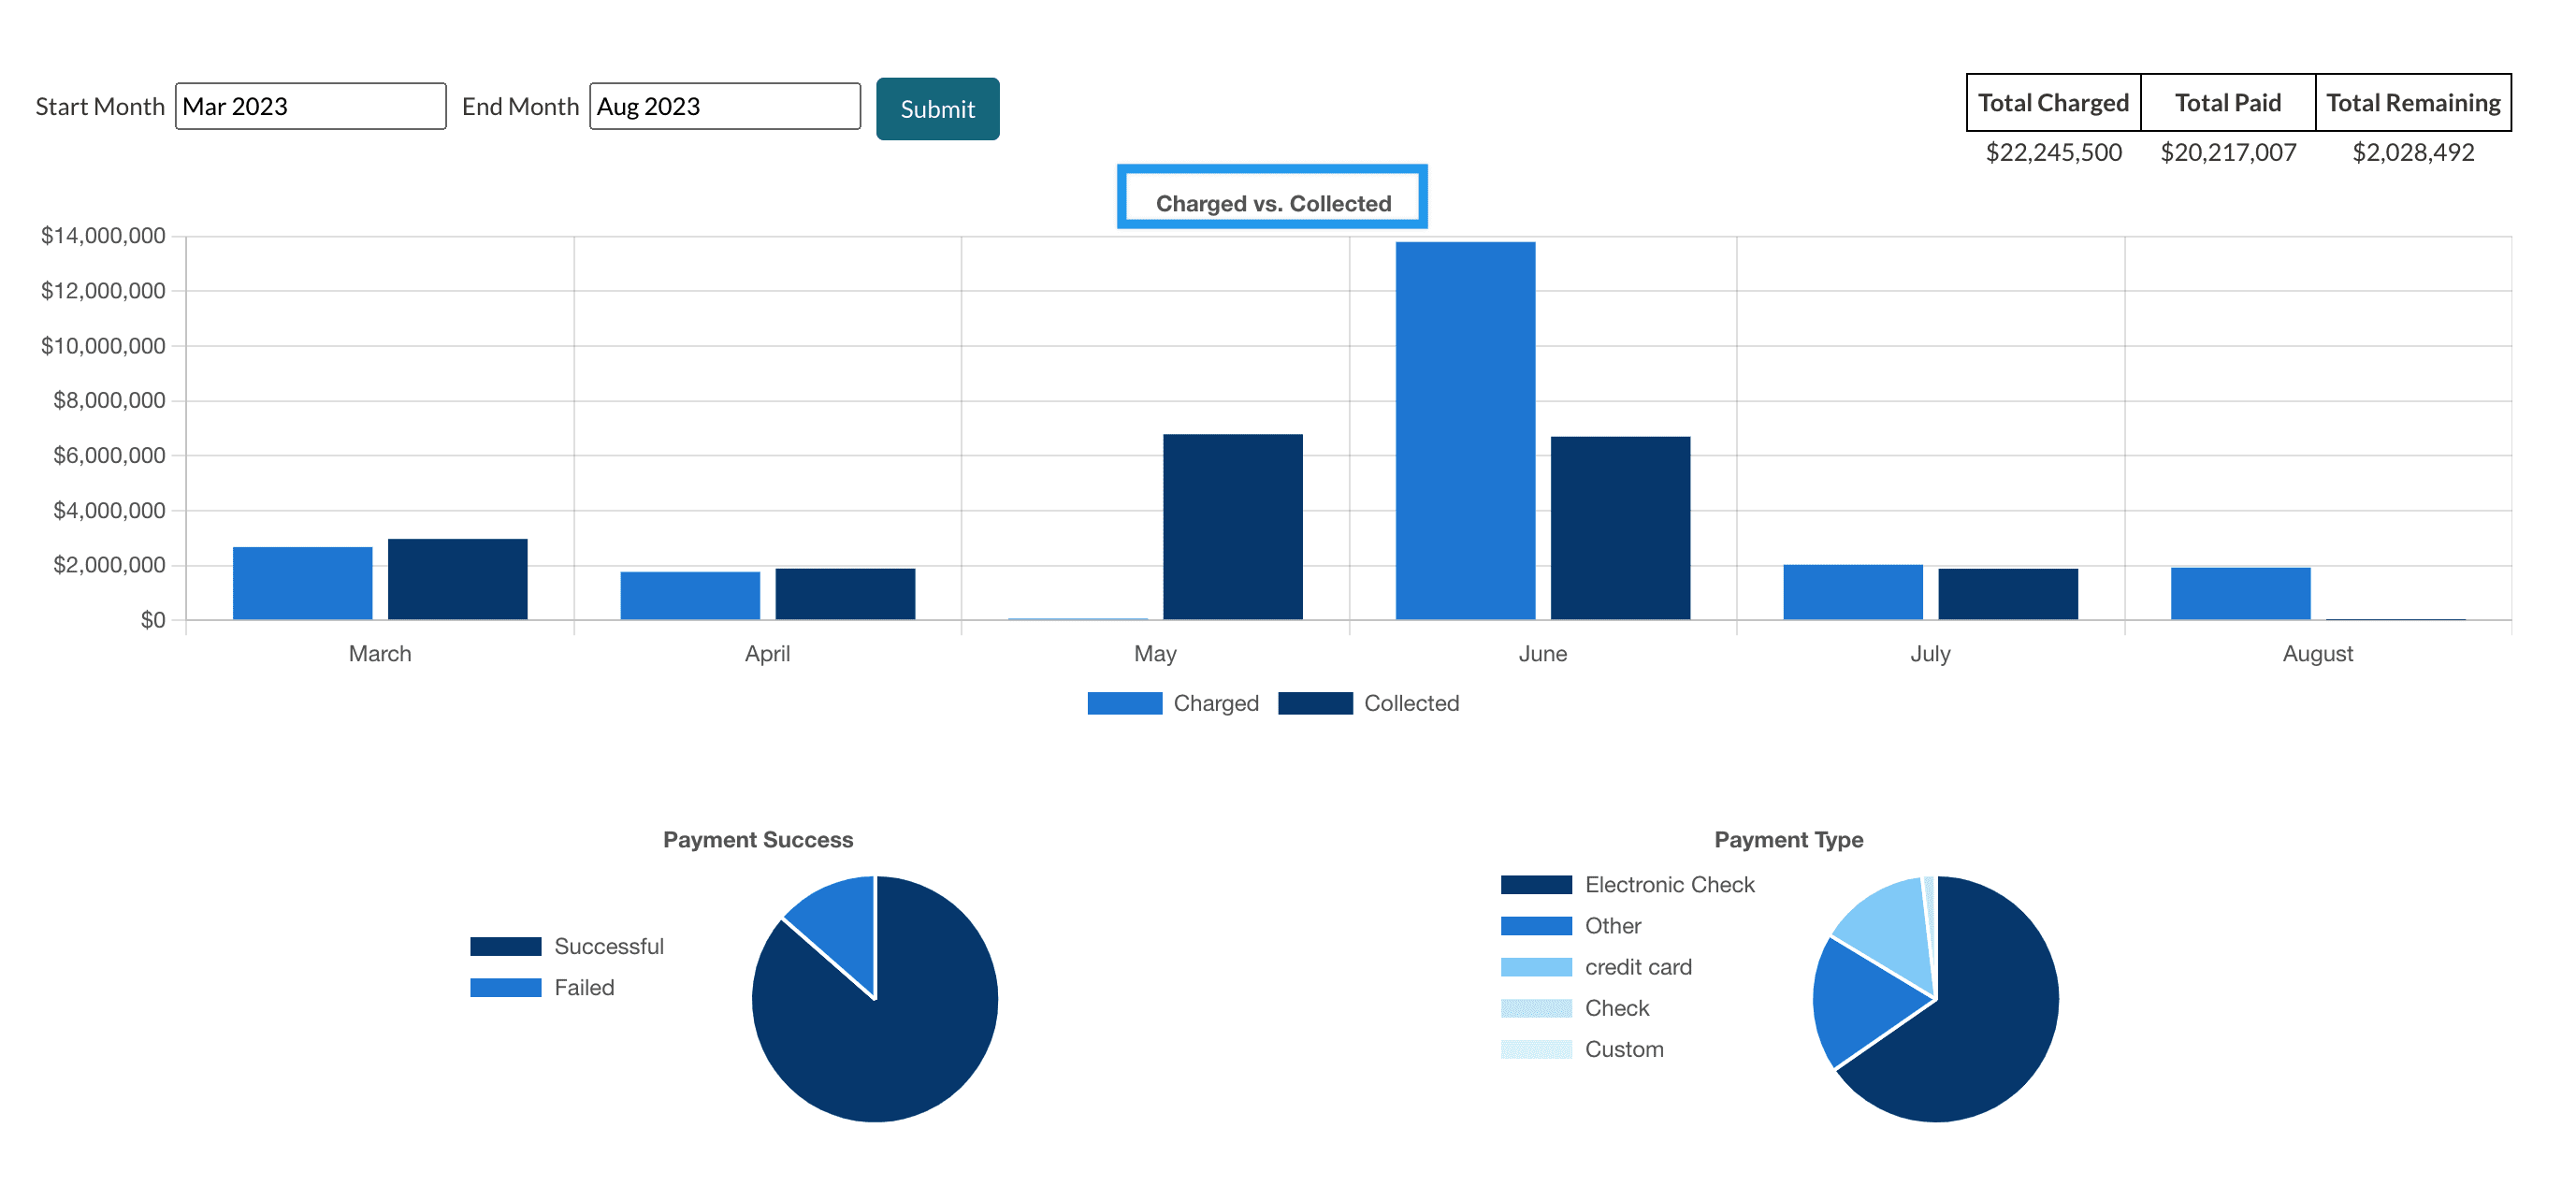
The lower section of the Billing Dashboard features a bar graph illustrating the monthly comparison between your school's total charges and your total collected amounts.
Both this bar graph and the pie charts below update with any new data every 10 minutes.
Charged vs Collected Defined
Charged: calculated by the total amount charged minus the total amount credited.
Collected: the total amount of all payments.

Filtering/Hover Options
- Start Month and End Month: Located above the graph, you have the option to apply filters to the data by selecting a start month and an end month.
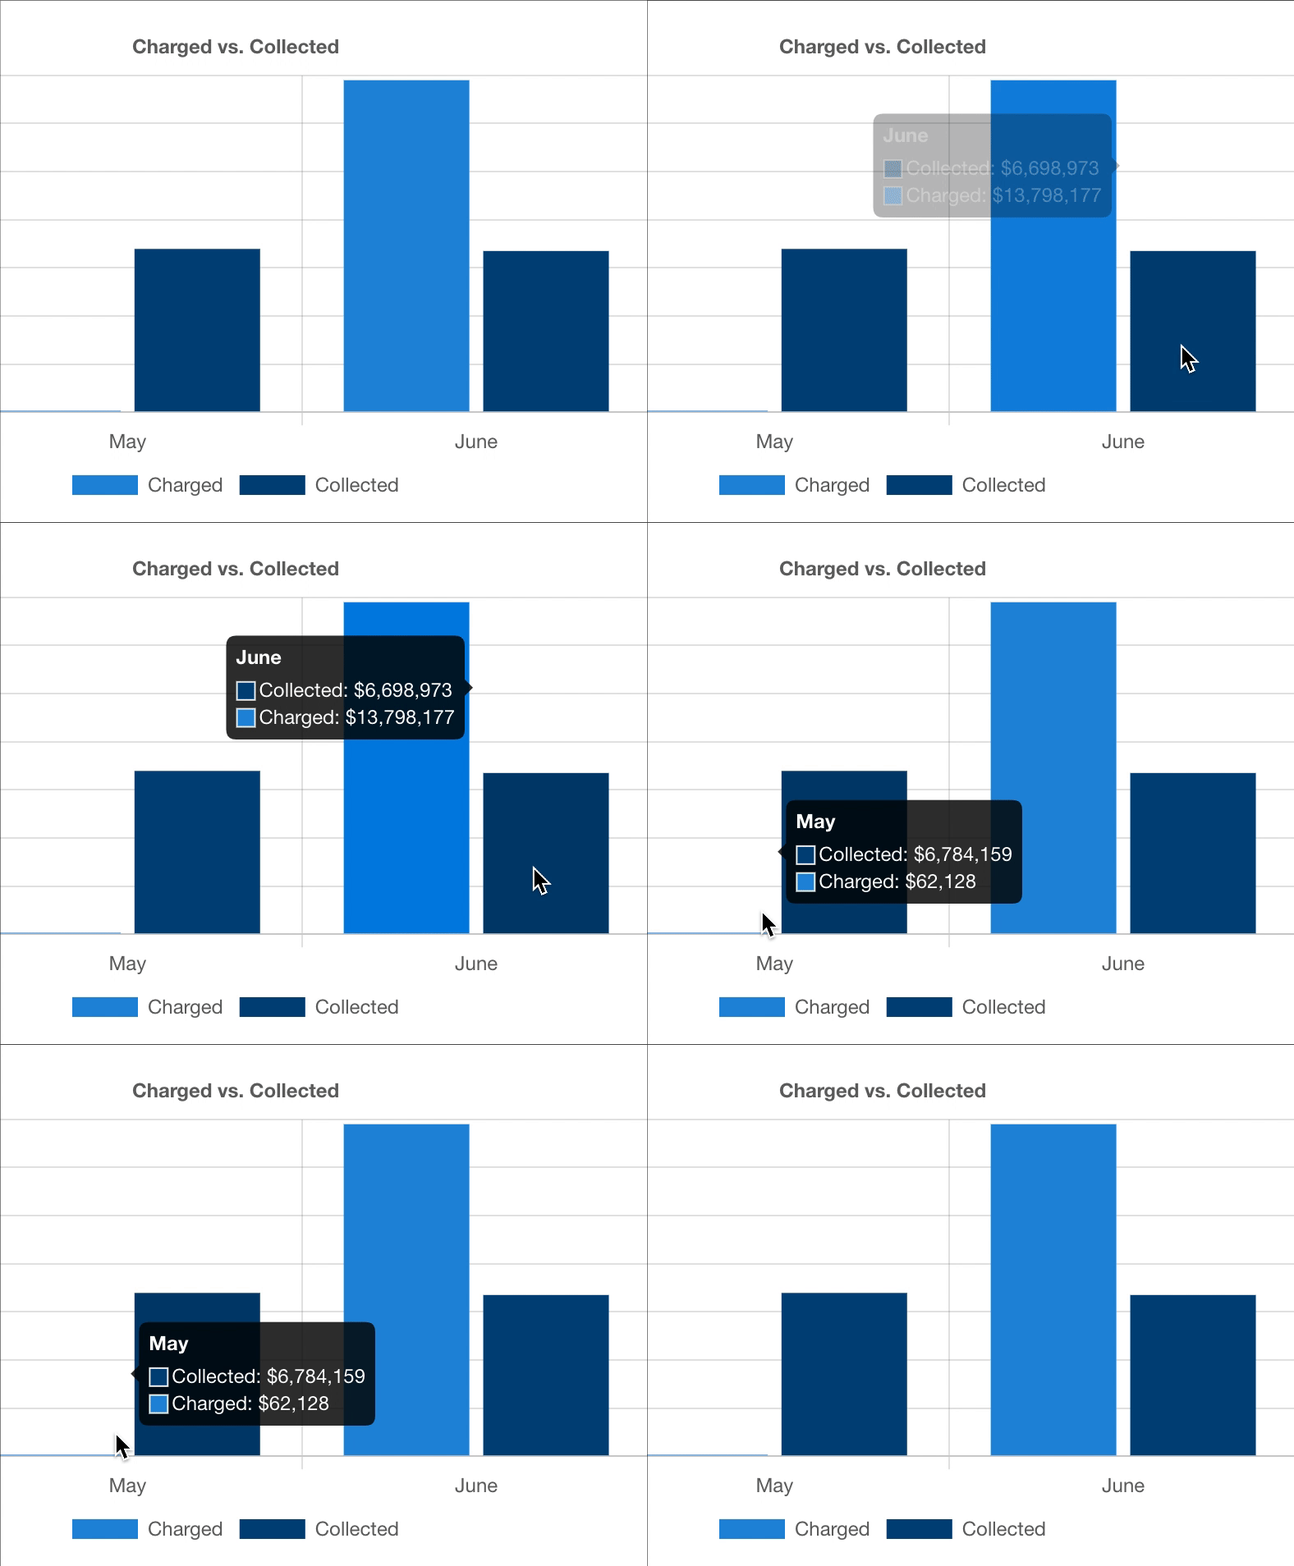
- Data while Hovering: When you place your cursor over the bars within the graph, the graph will reveal the total amounts collected and charged for that month.
-
Filter by Charged or Collected: You can filter the graph to display either only the data bars for Collected payments or exclusively for Charged payments.
- Select either Charged or Collected below the graph to exclude that data from the display.
Payment Success and Payment Type
Beneath that chart, you'll find two pie charts that provide supplementary information:
- Payment Success: Showing the amount of successful payments compared to the amount of failed payments.
- Payment Type: Provides a breakdown of all payment types utilized on your site.
Data while Hovering: Place your cursor over each segment within the charts to reveal the total dollar amount associated with each category.


Comments
0 comments
Article is closed for comments.