Overview
Within the Search tab, you can select different layouts for your reports to visualize your data in a variety of ways, such as a search grouped on a specific field or a summary report.
In this article
Change Display/Columns
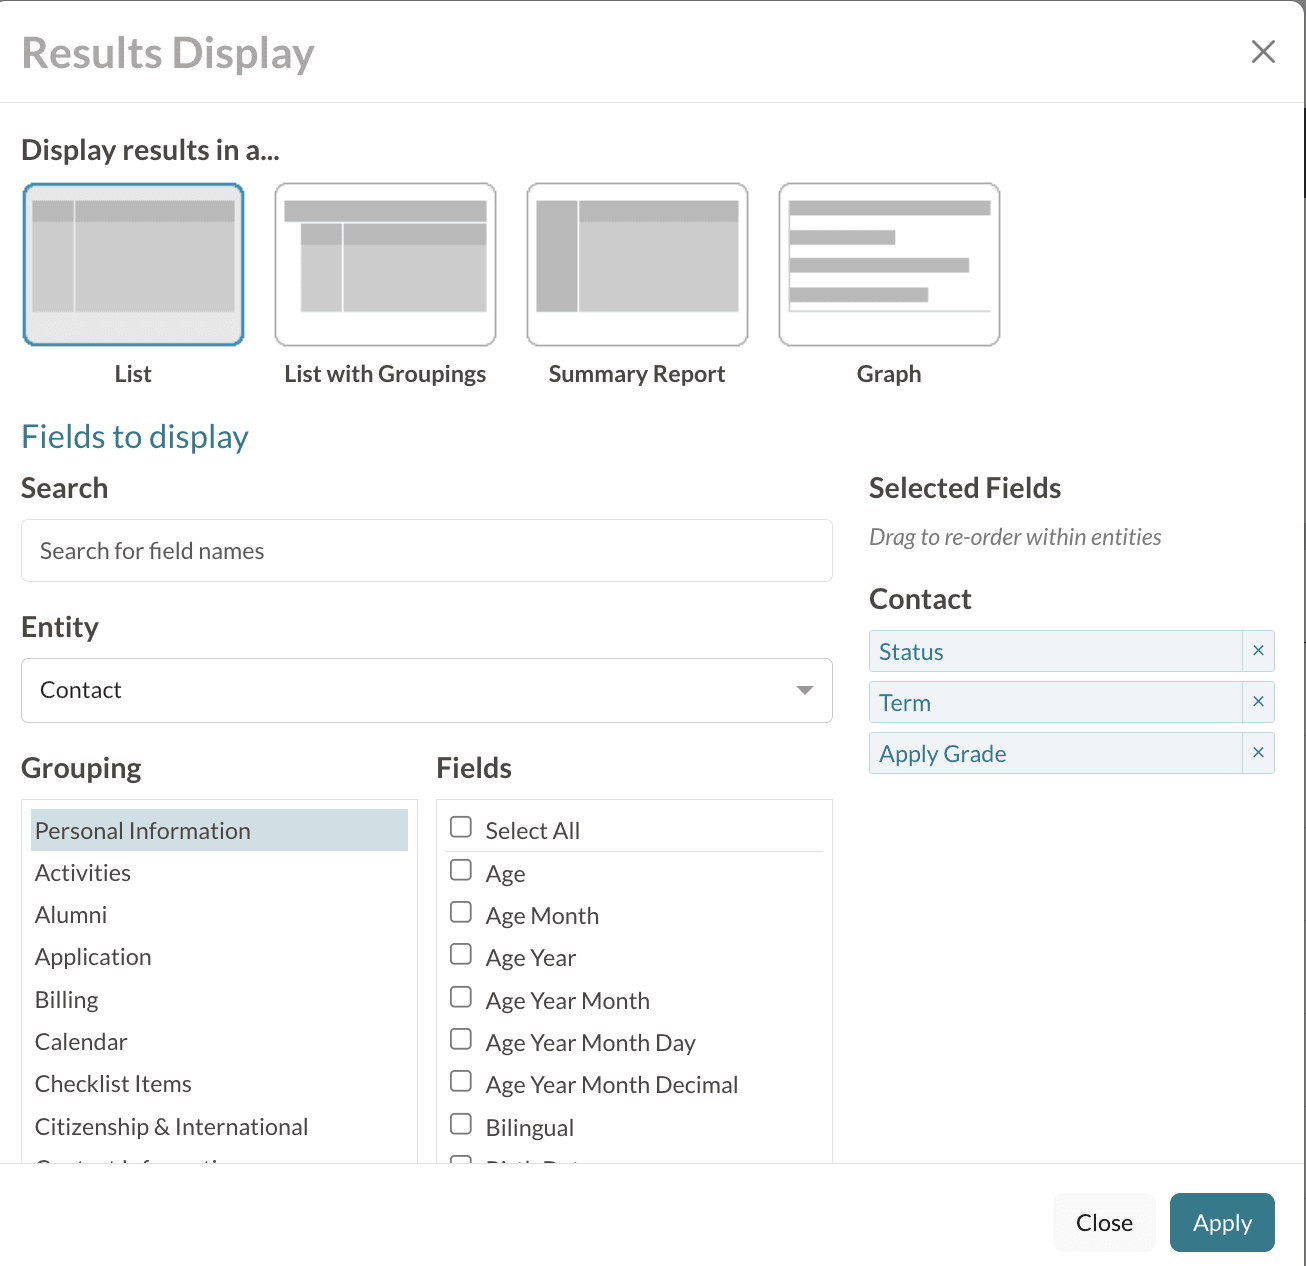
After you've entered your search criteria and hit Search, you will be able to click the Change Display/Columns button in the upper right of the page. This will open the Results Display window.
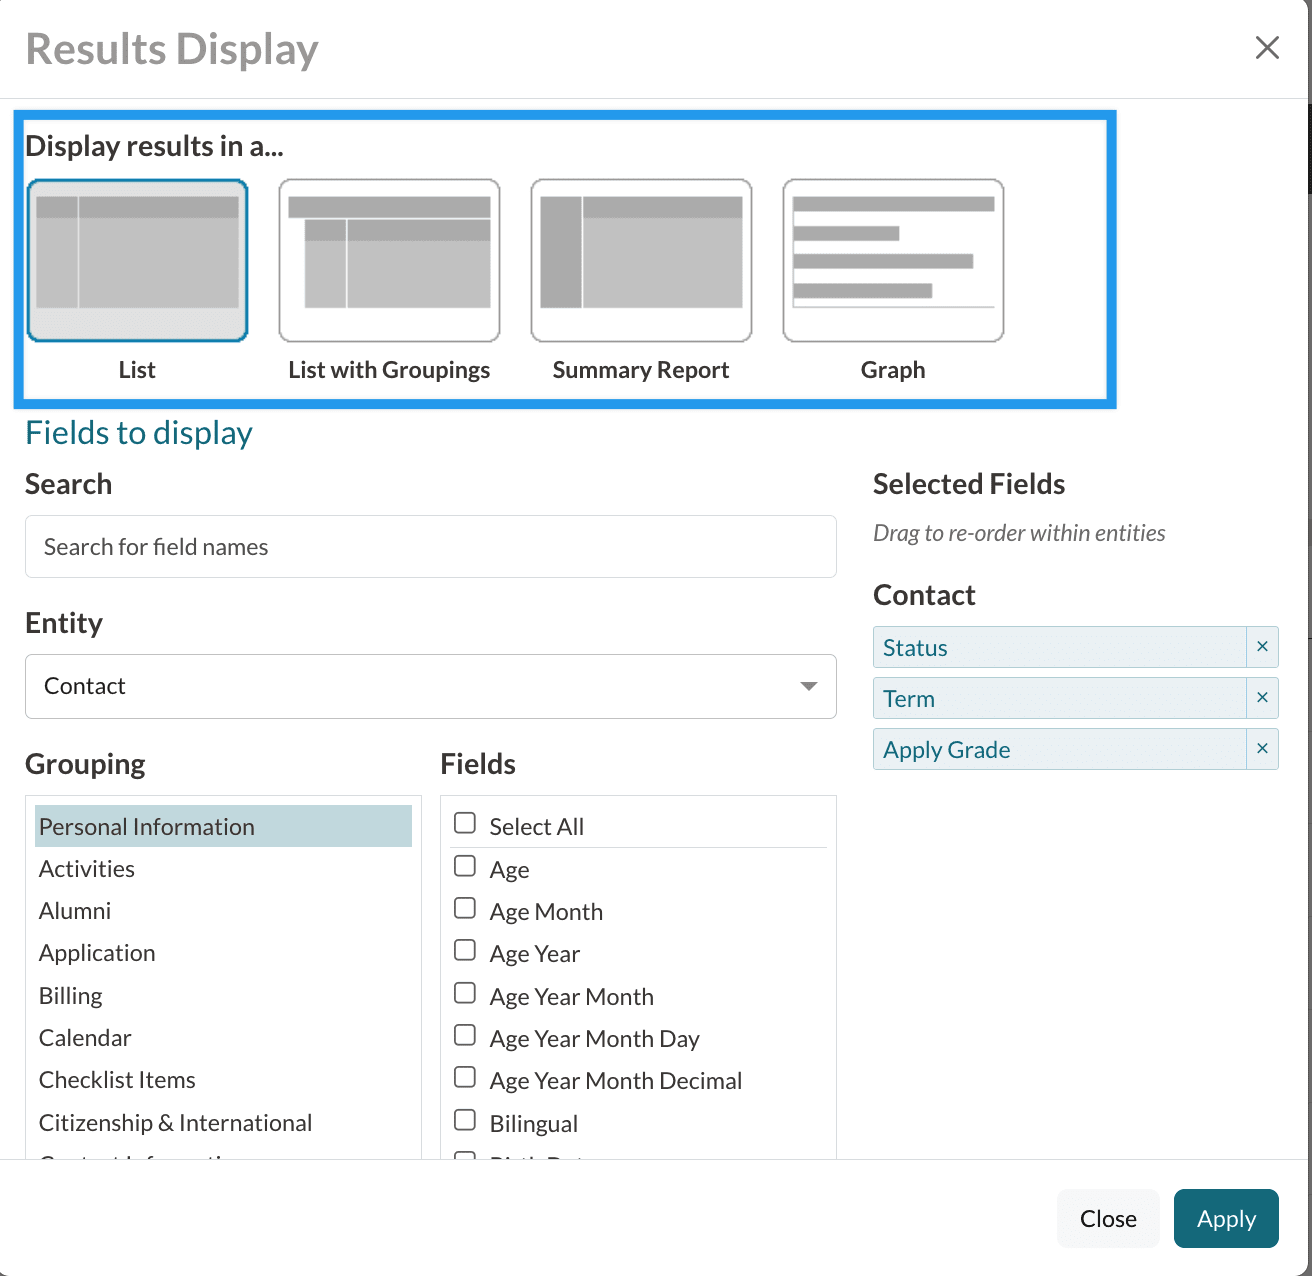
- Within the Results Display window, there are four different results displays: List, List with Groupings, Summary Report, and Graph.
- You can also add additional fields to display as columns in the report.
Click the blue Apply button to submit your changes.
Add and/or rearrange columns in a search
Use the Change/Display Columns button to pull in additional columns to List or List with Groupings searches.
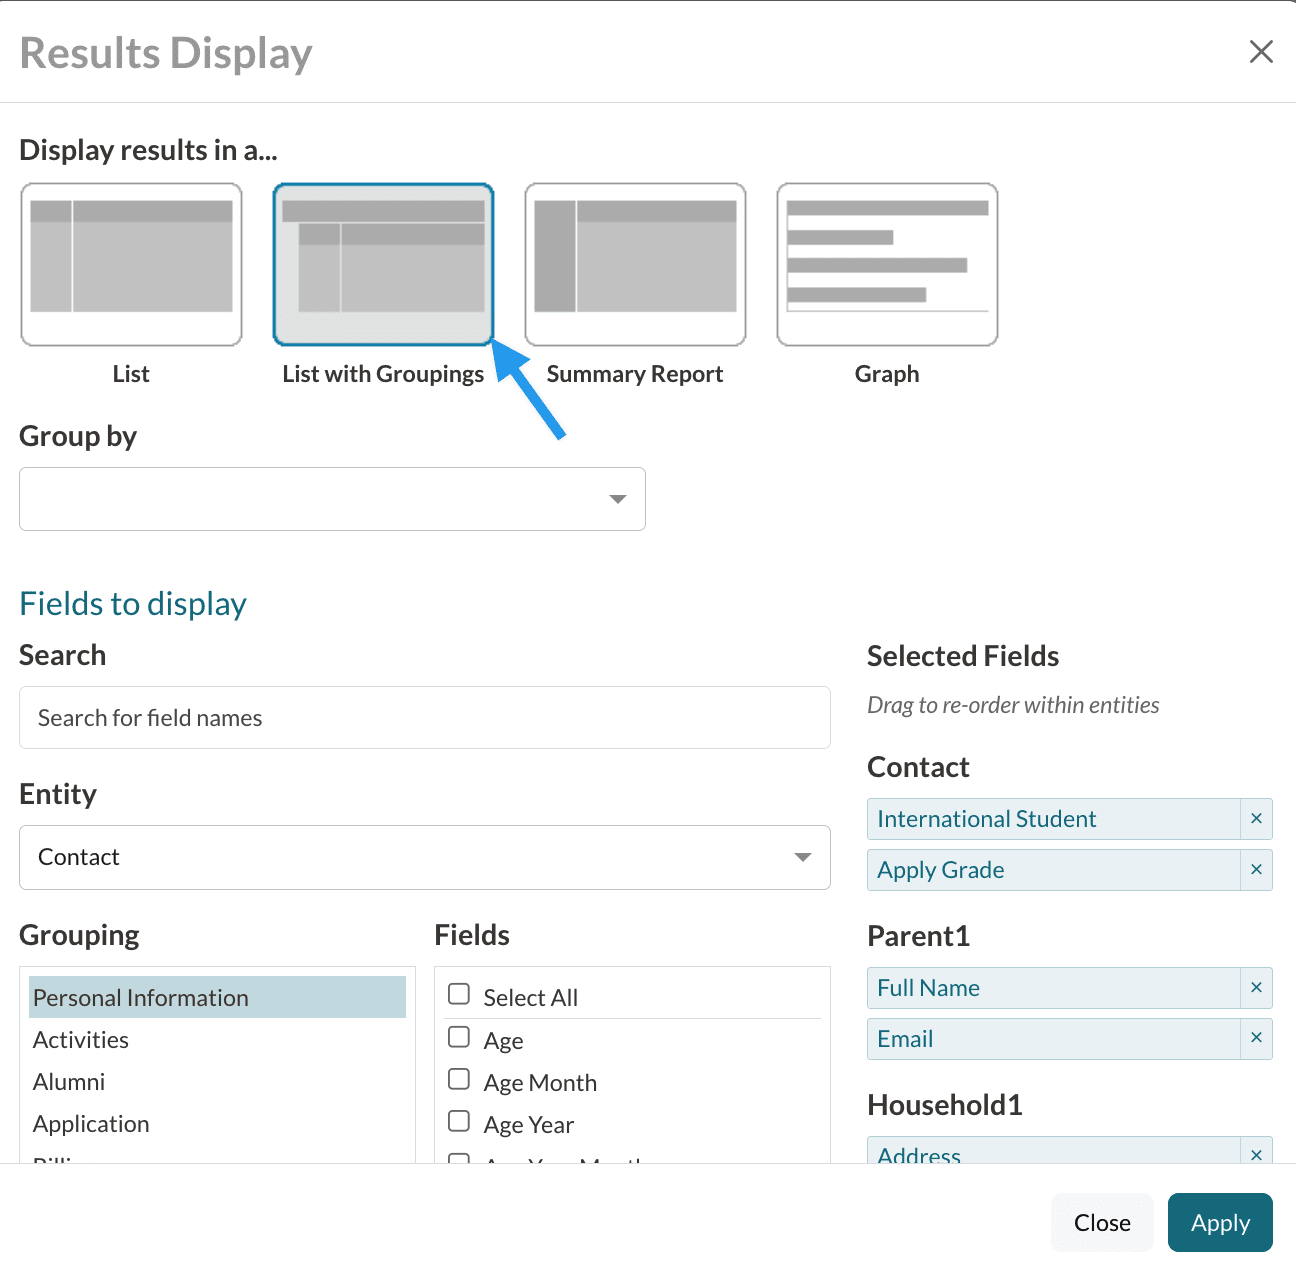
Within the pop-up, the List display option is automatically selected since this is the default view. If you are creating a List with Groupings search, start by selecting that option in the section that says "Display results in a..."
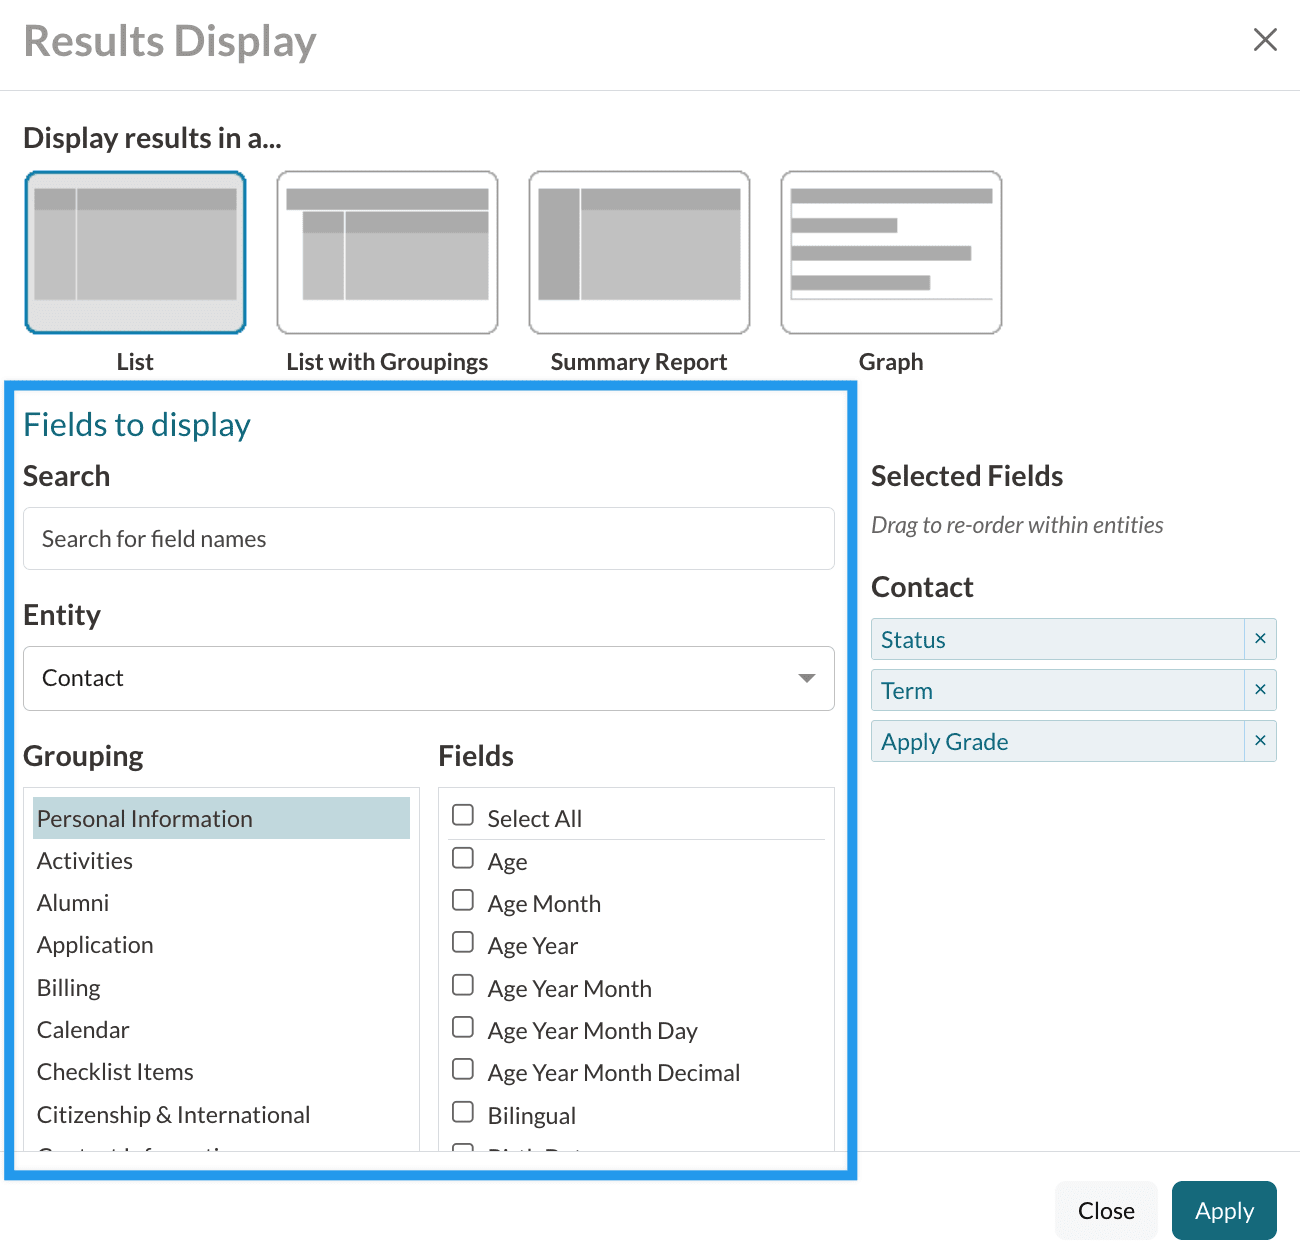
Fields to Display is where you can select additional fields to pull into the search. (They will display as columns within the report.)
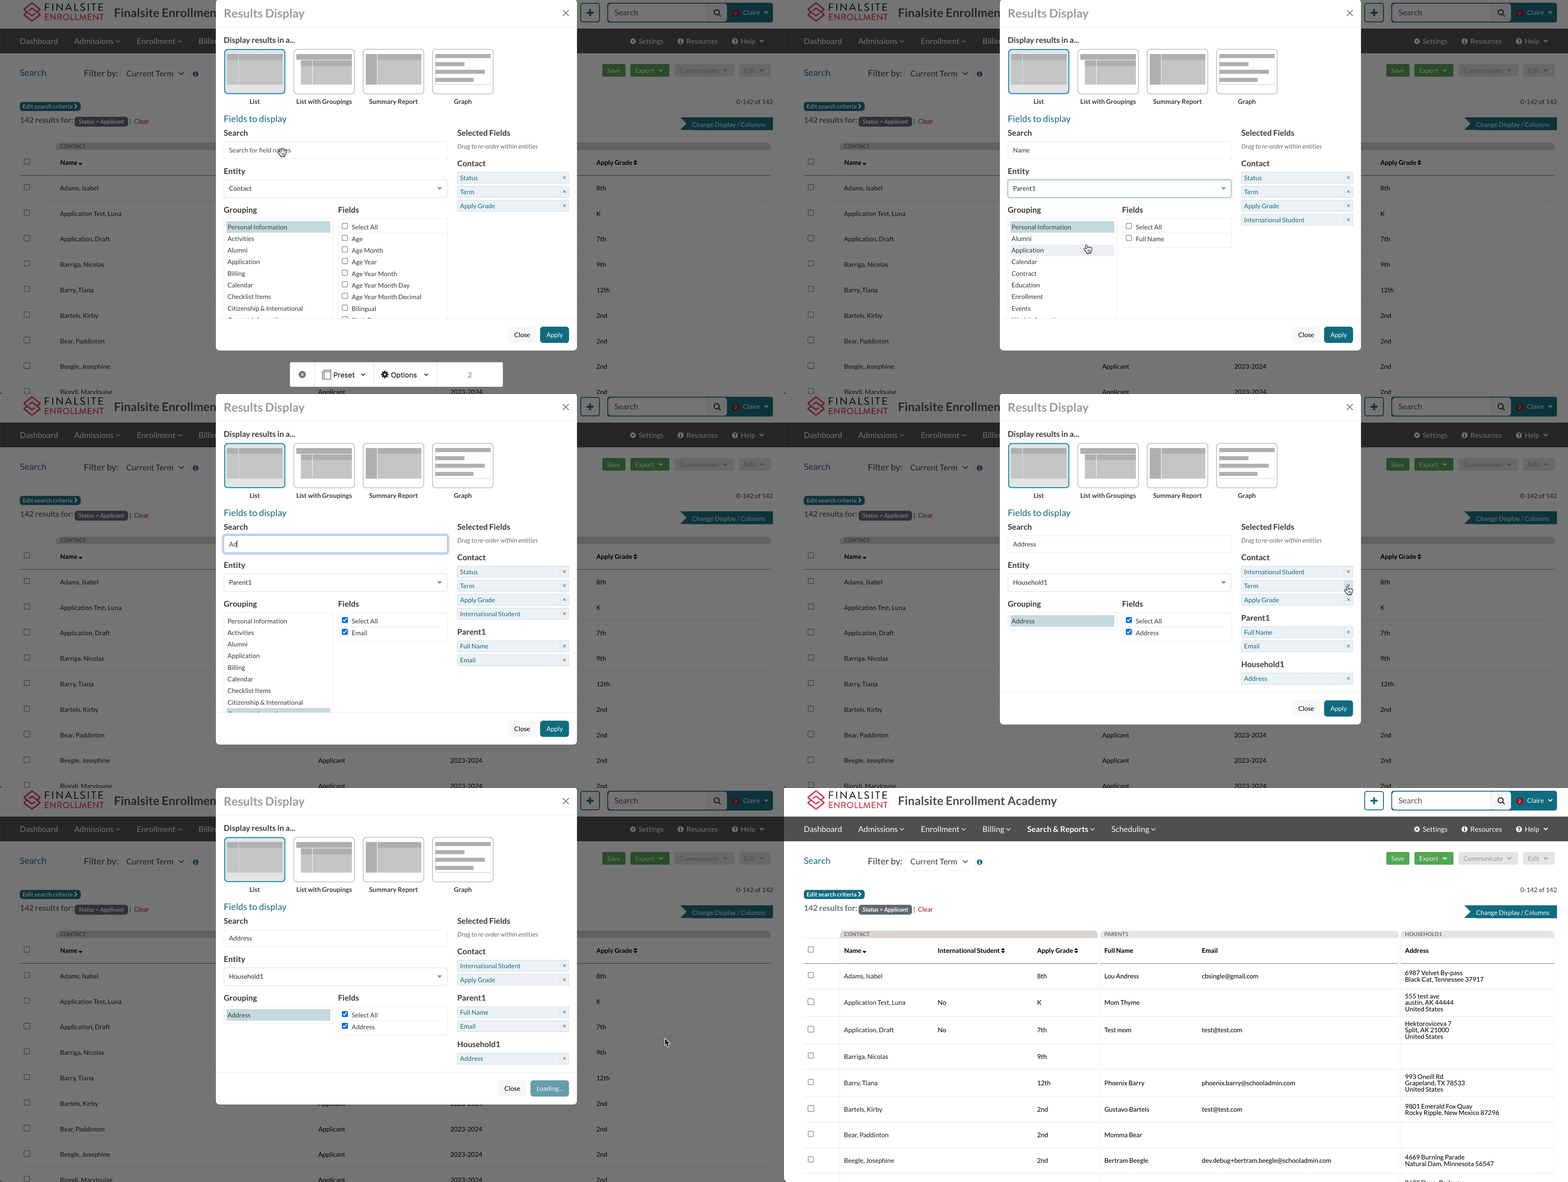
You can search for a field by typing the field name into the search bar, or you can manually scroll and open the different groups of fields to see a list of every field within a specific group.
Search Bar
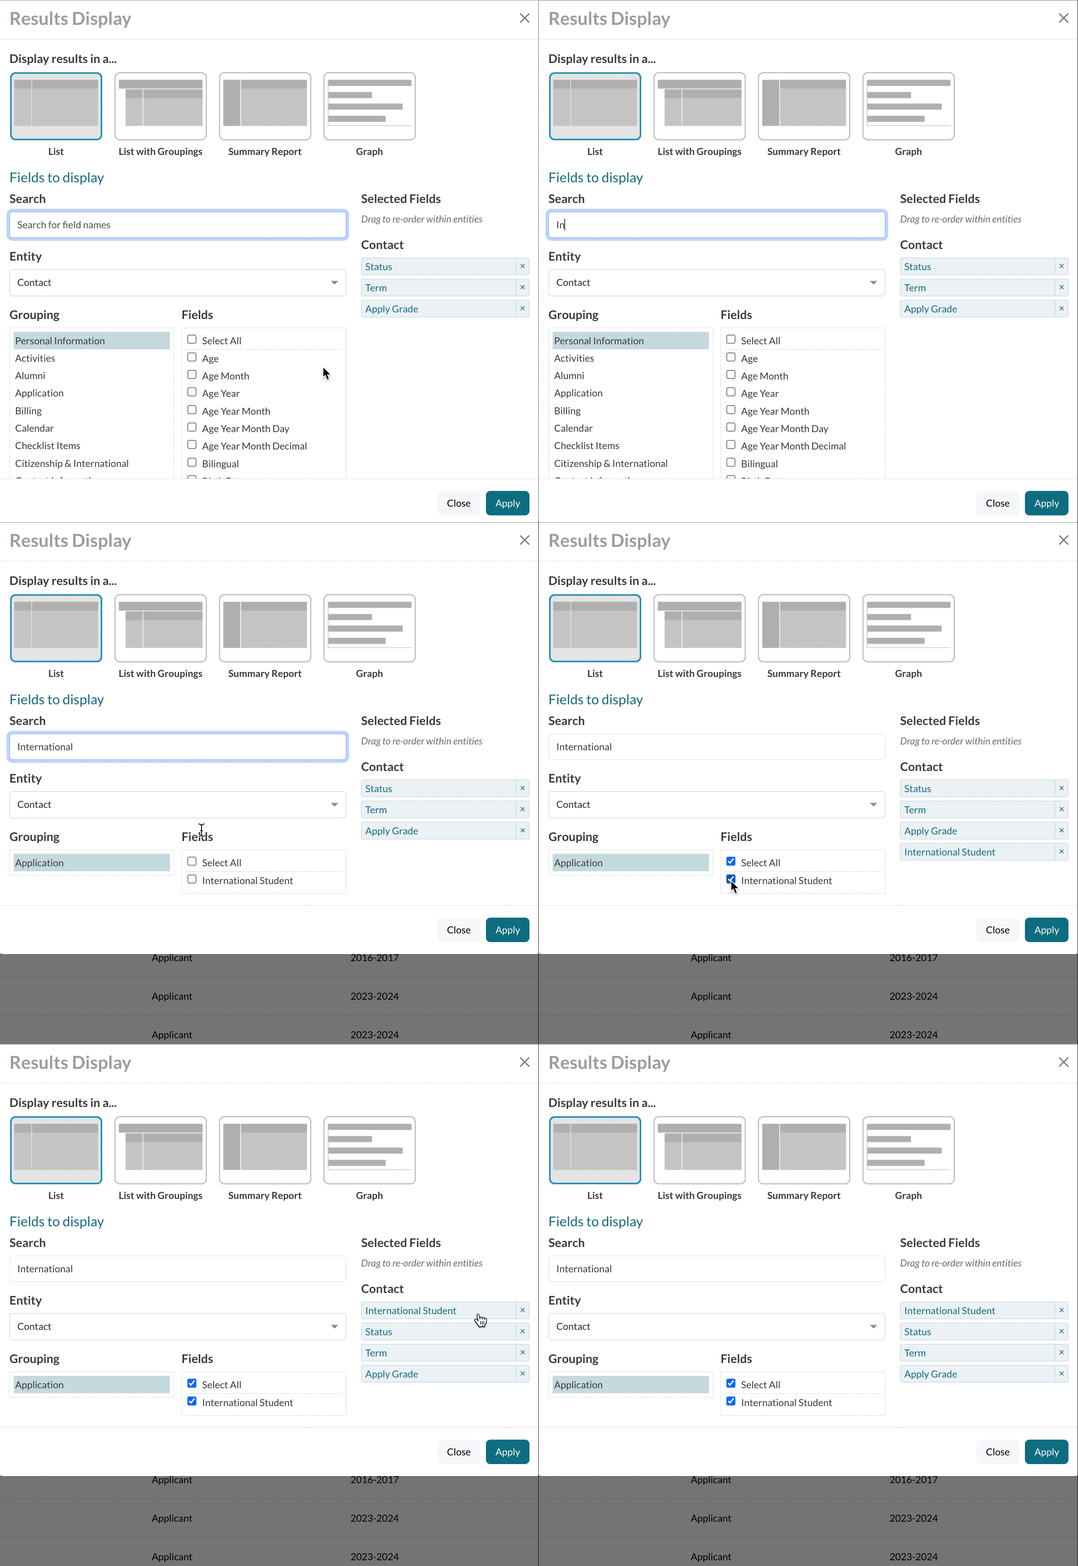
Here, you can type in the name of the field you are looking for. When you begin typing, you will see the options in the Grouping and Field sections update based on what you are entering.
Once you search for a field, check the checkbox in the Fields section to pull it into the Selected Fields section. This will allow it to be displayed as a column in your search.
You can then drag and drop the field within the Selected Fields section to change the order it appears within your search. Dragging it toward the top of the list moves it to the left within the displayed results of your search.
Good to know:
- In student-based searches, the name of the student will always be the first column within your search even if you drag a field all the way to the top of the list within the Selected Fields section.
- If you need a refresher on how to find field names, check out this article: How to Find Fields
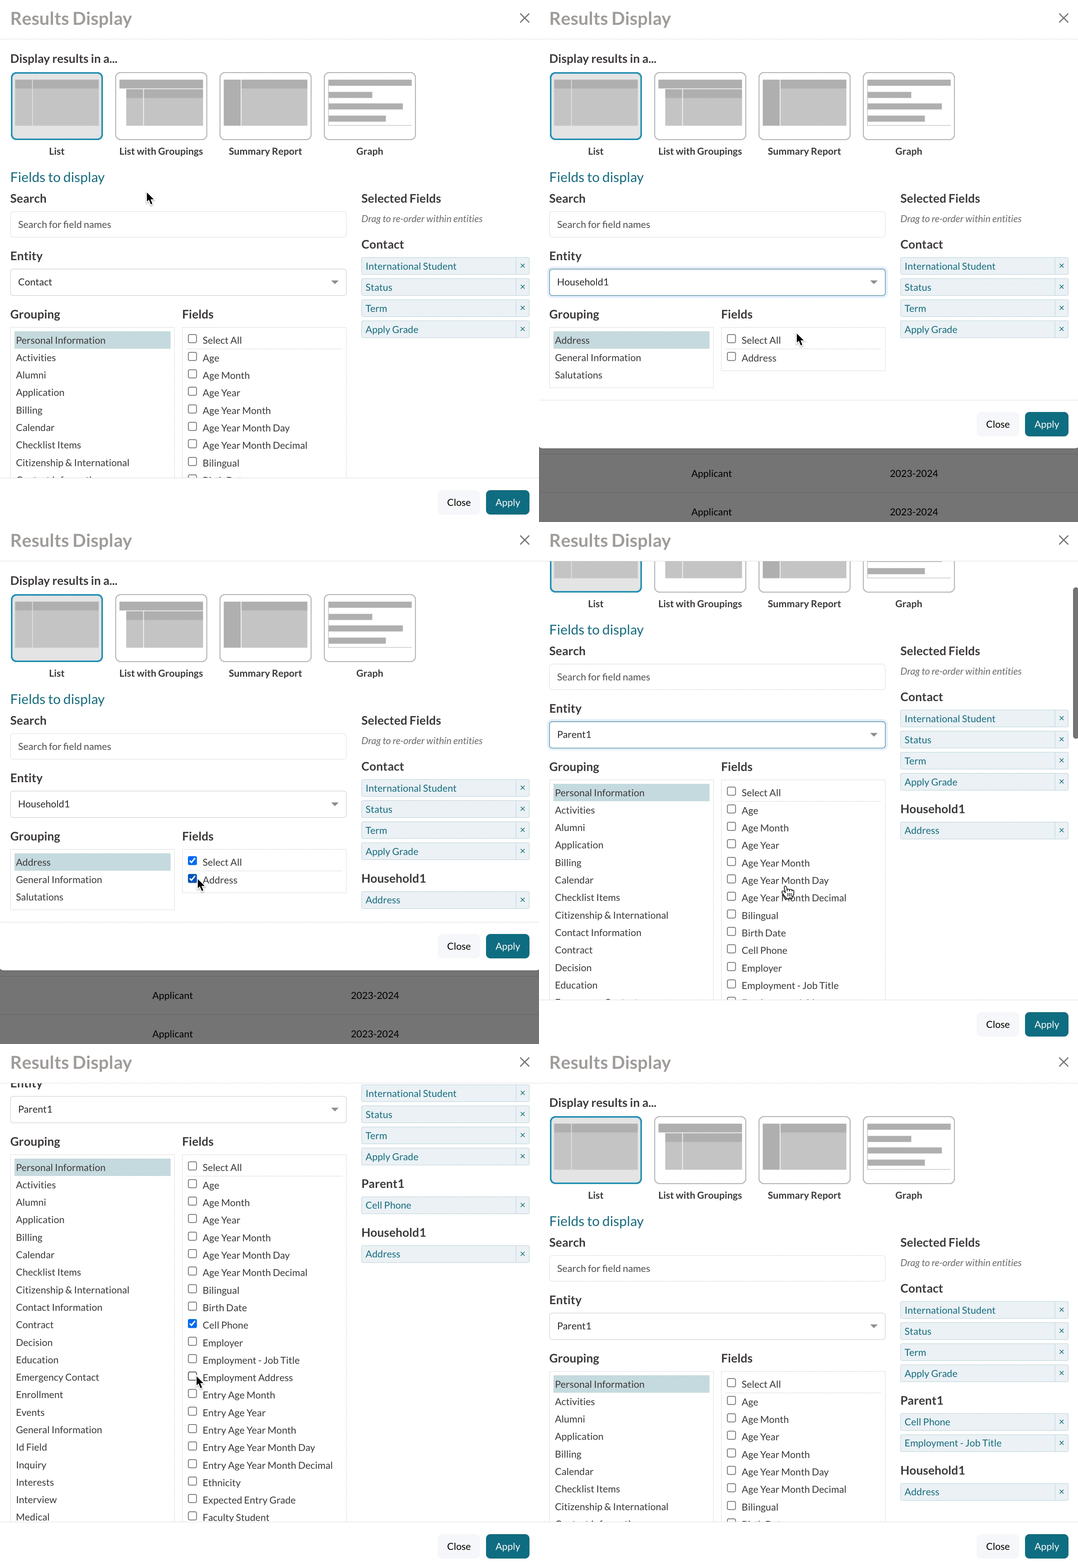
Entity options
Your options can also be narrowed by specifying an Entity. Entity options are essentially a way for the system to know who the information belongs to. Update the value in the Entity drop-down to see the list of fields related to students, parents, siblings, or households.
This can be helpful if you are not sure exactly what field to search for but would like to see a list of fields related to a group. For example, if you wanted to see all fields with information about a student's primary parent, you would select Parent 1 as the Entity to browse through related fields and select the ones you need.
- Contact: Information related to the student.
- Household 1: Information related to the student's primary address.
- Household 2: Information relating to the student's second household address.
- Parent 1: Information related to the student's primary parent residing in the primary household (household 1.)
- Parent 2: Information related to the student's second parent residing in the primary household (household 1.)
- Parent 3: Information related to a parent residing in the student's second household (household 2.)
- Parent 4: Information related to a parent residing in the student's second household (household 2.)
-
Sibling: Information related to the student's siblings. By default, the system will pull all sibling entities 0-9 into the report, resulting in 10 Sibling columns.
- Please note: Finalsite Enrollment supports up to 10 sibling entities per student, and the system will always display all 10 sibling entities when retrieving sibling data in searches. Learn more about sibling entities and how to build a sibling report by visiting the "How to build a search to display sibling data" article.
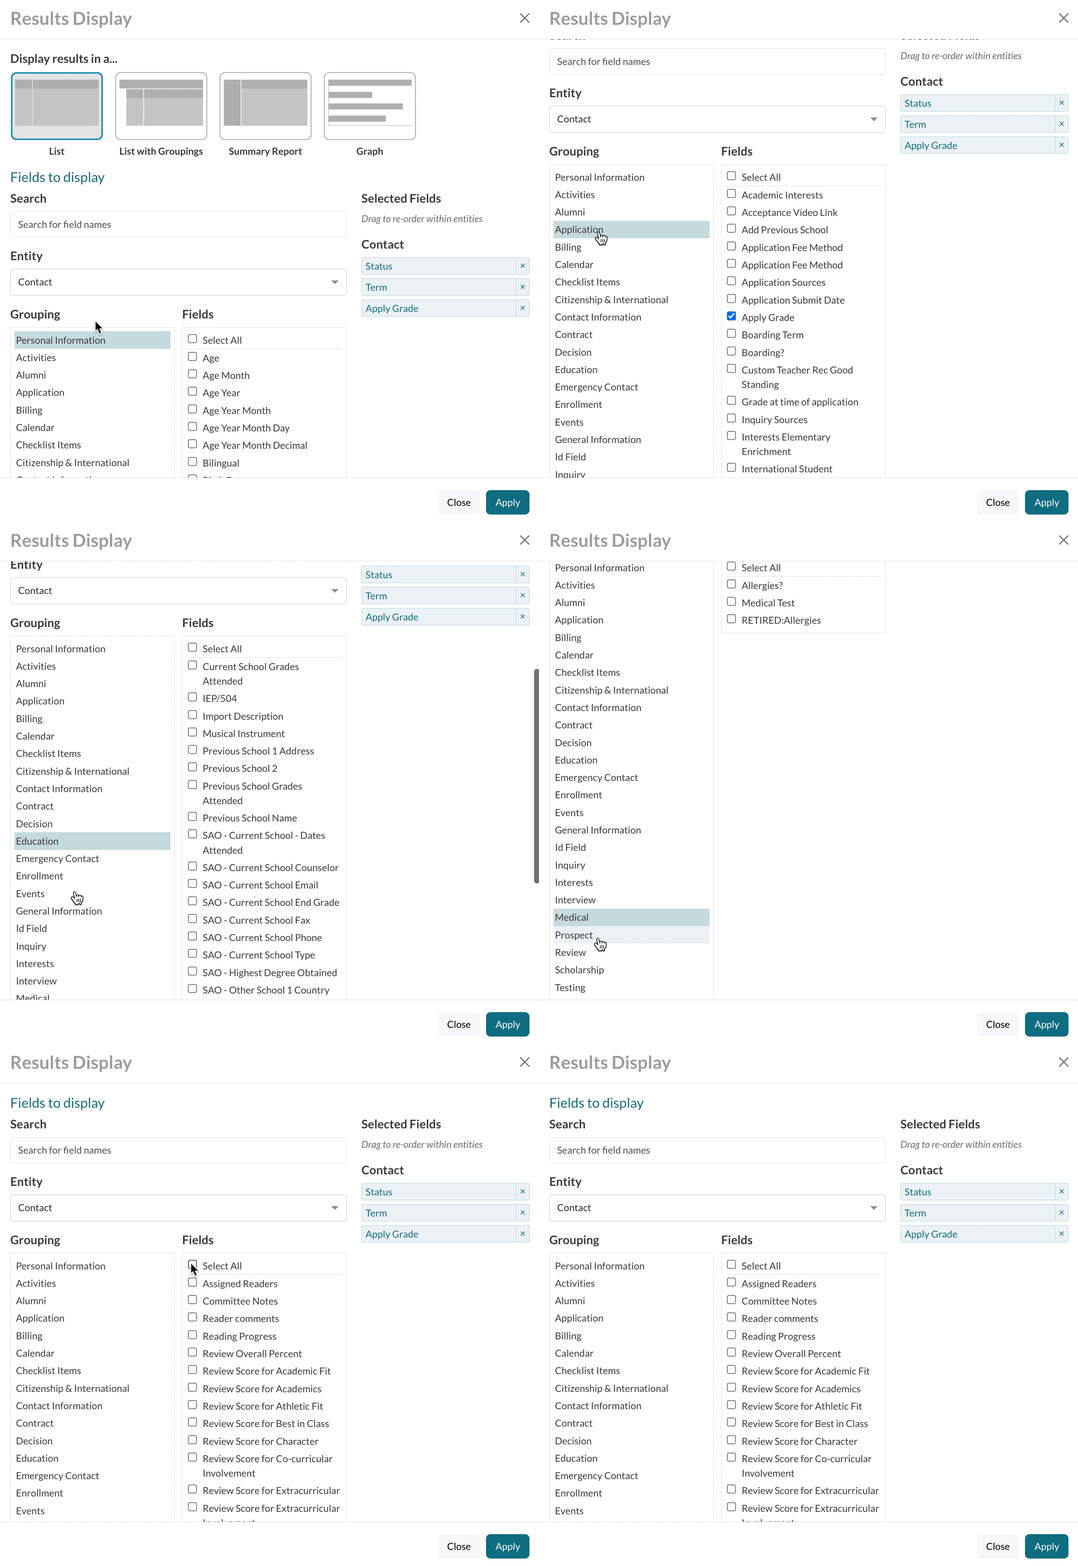
Grouping
Grouping is the section that the field is grouped under within the Fields page. For example, information like name and date of birth are typically found grouped under the Personal grouping.
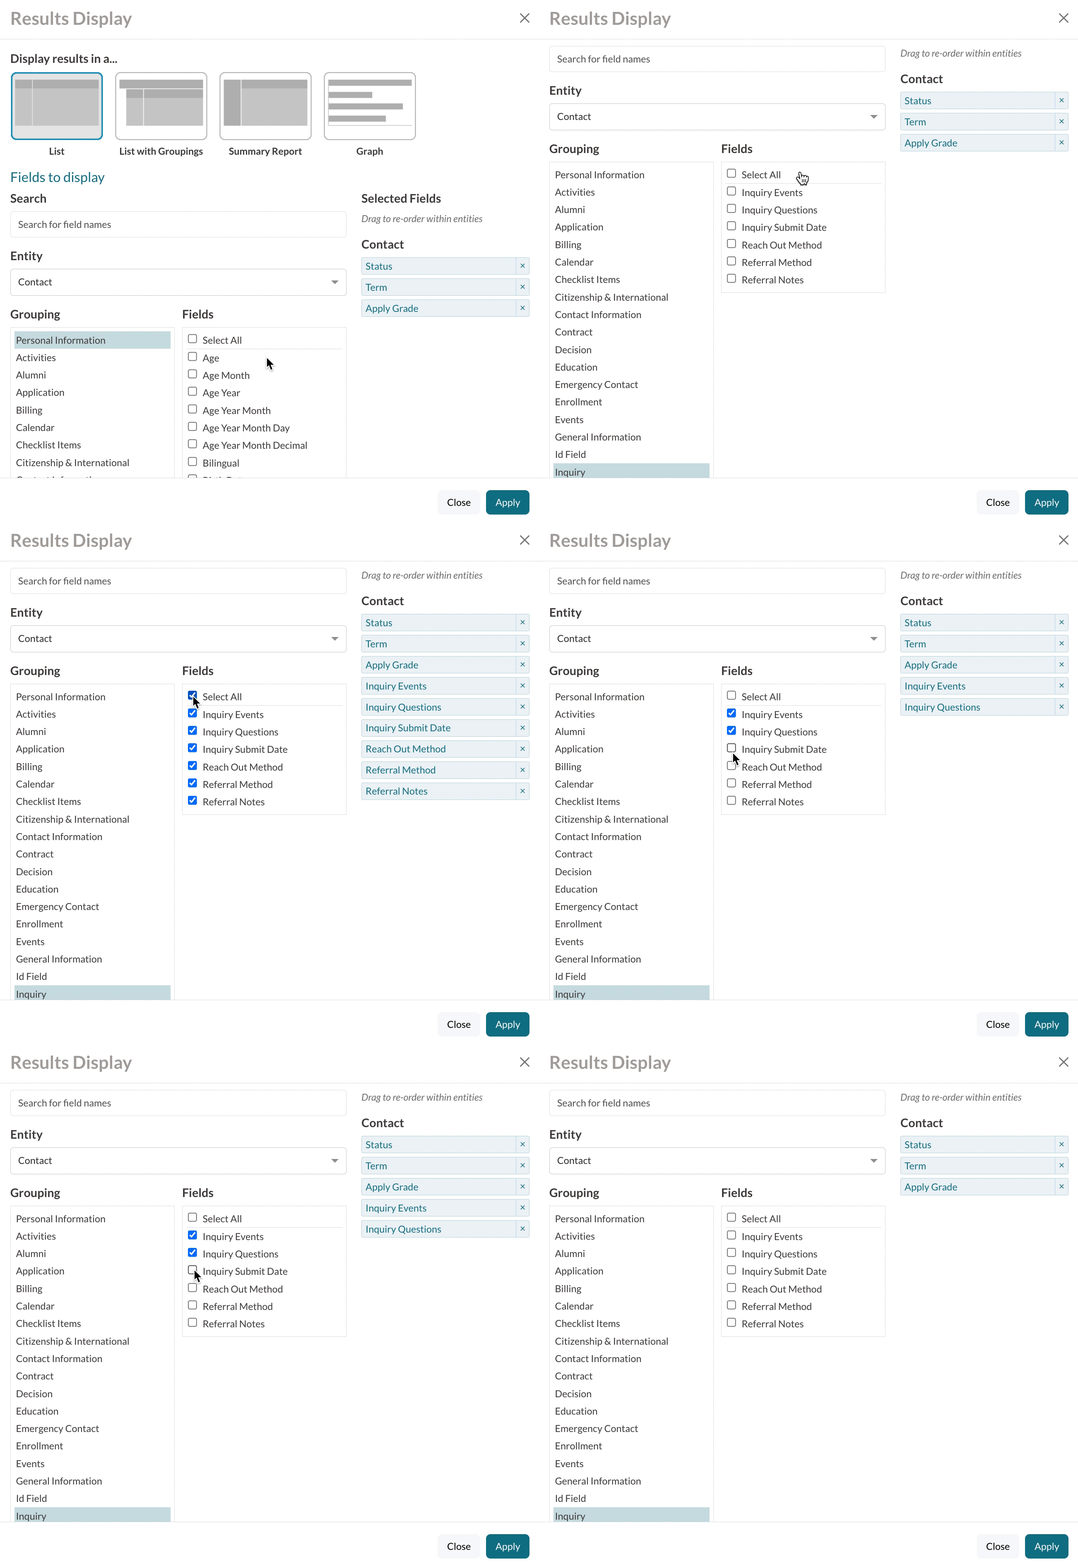
When you select a group, all fields within that group appear automatically in the fields section. You can scroll through them and select them individually or use Select All at the top to select all fields within your selected group.
Fields
This section is where your searched-for fields appear, whether you narrow them down by using the search function or opening different groups or entities.
The Select All option at the top, selects every field currently listed within the Fields section.
You can also select and deselect fields in that section individually. Deselecting a field removes it from the Selected Fields section (and therefore removes it from the search columns.)
Selected Fields
When you select one of the fields, it will appear in a list under the Selected Fields section on the right.
- Drag and drop the field to move its position within the search. Dragging the field to the top of the list moves it to the left within the search display.
- Click the X next to any of the fields you pulled in to remove it.
- Once you click Apply, your selected field(s) are added to your search as a new column(s). For some fields, clicking the column header within the search allows you to order the search based on the data in that column.
Good to know: Rearranging Columns
- The only column that can’t be moved is the contact (student) name column. All other columns can be rearranged by opening the change/display window and dragging the column to the order that you want it to appear in.
- Dragging a column to the top of the list will move it to the left.
- You can only change their order in the change/display window, you can’t move them by dragging them in the search itself.
- The ability to relocate the column is segmented by contact type. For example, if you pull Parent 1 information into the search, you’ll be able to sort the columns related to Parent 1 separately from the columns related to the student.
Types of Searches
List
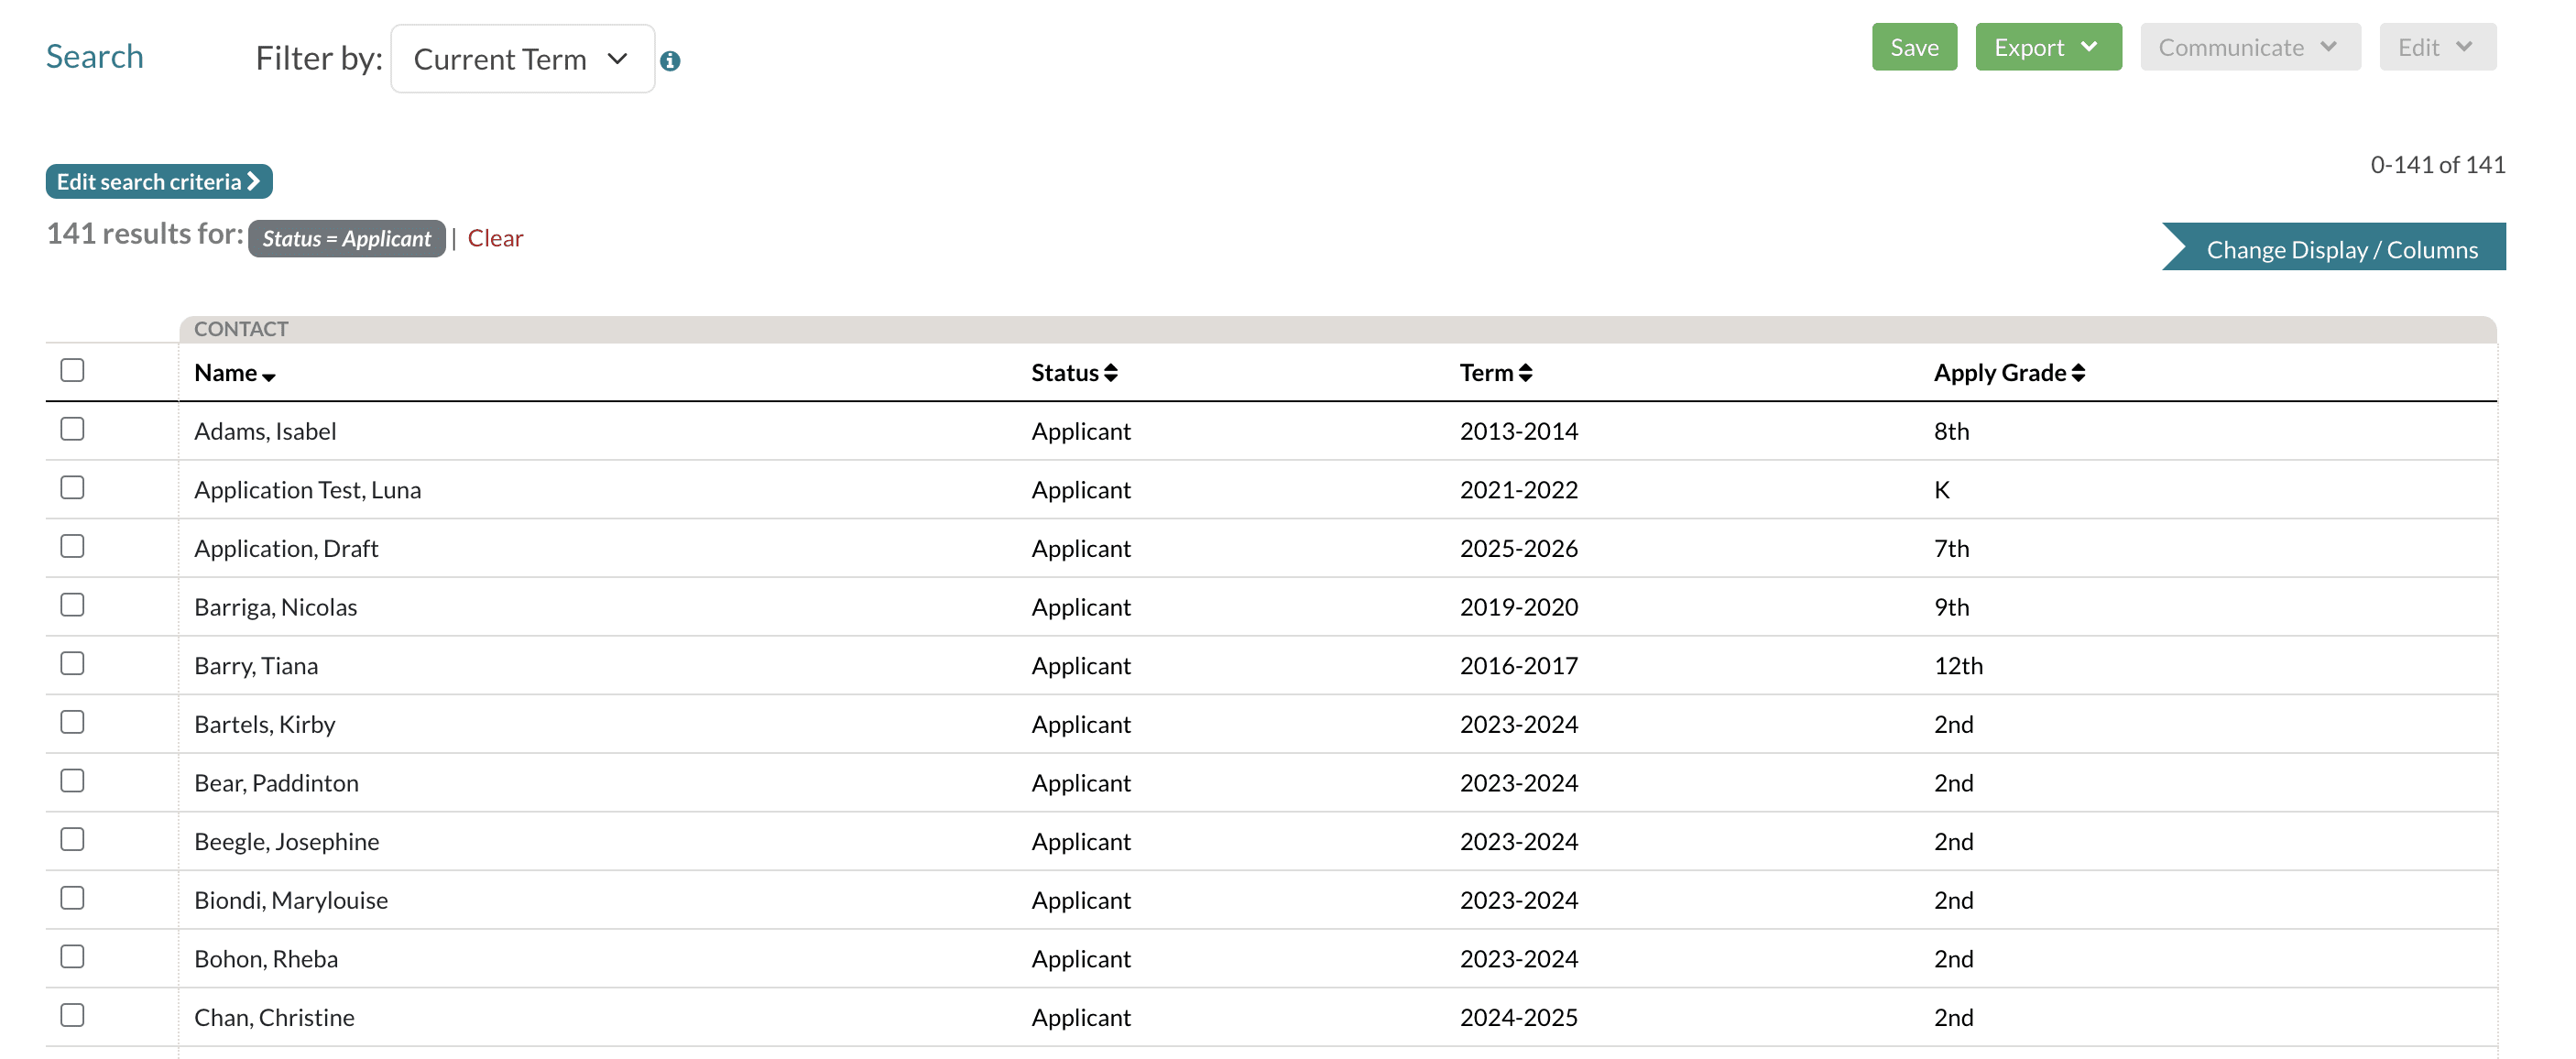
The List results display is the default view of your search results. It displays your results in a list format with the contact name appearing in the first column.
In addition to the name, you'll see a few other standard columns that automatically appear when you run a search (they depend on what criteria you search by).
List with Groupings
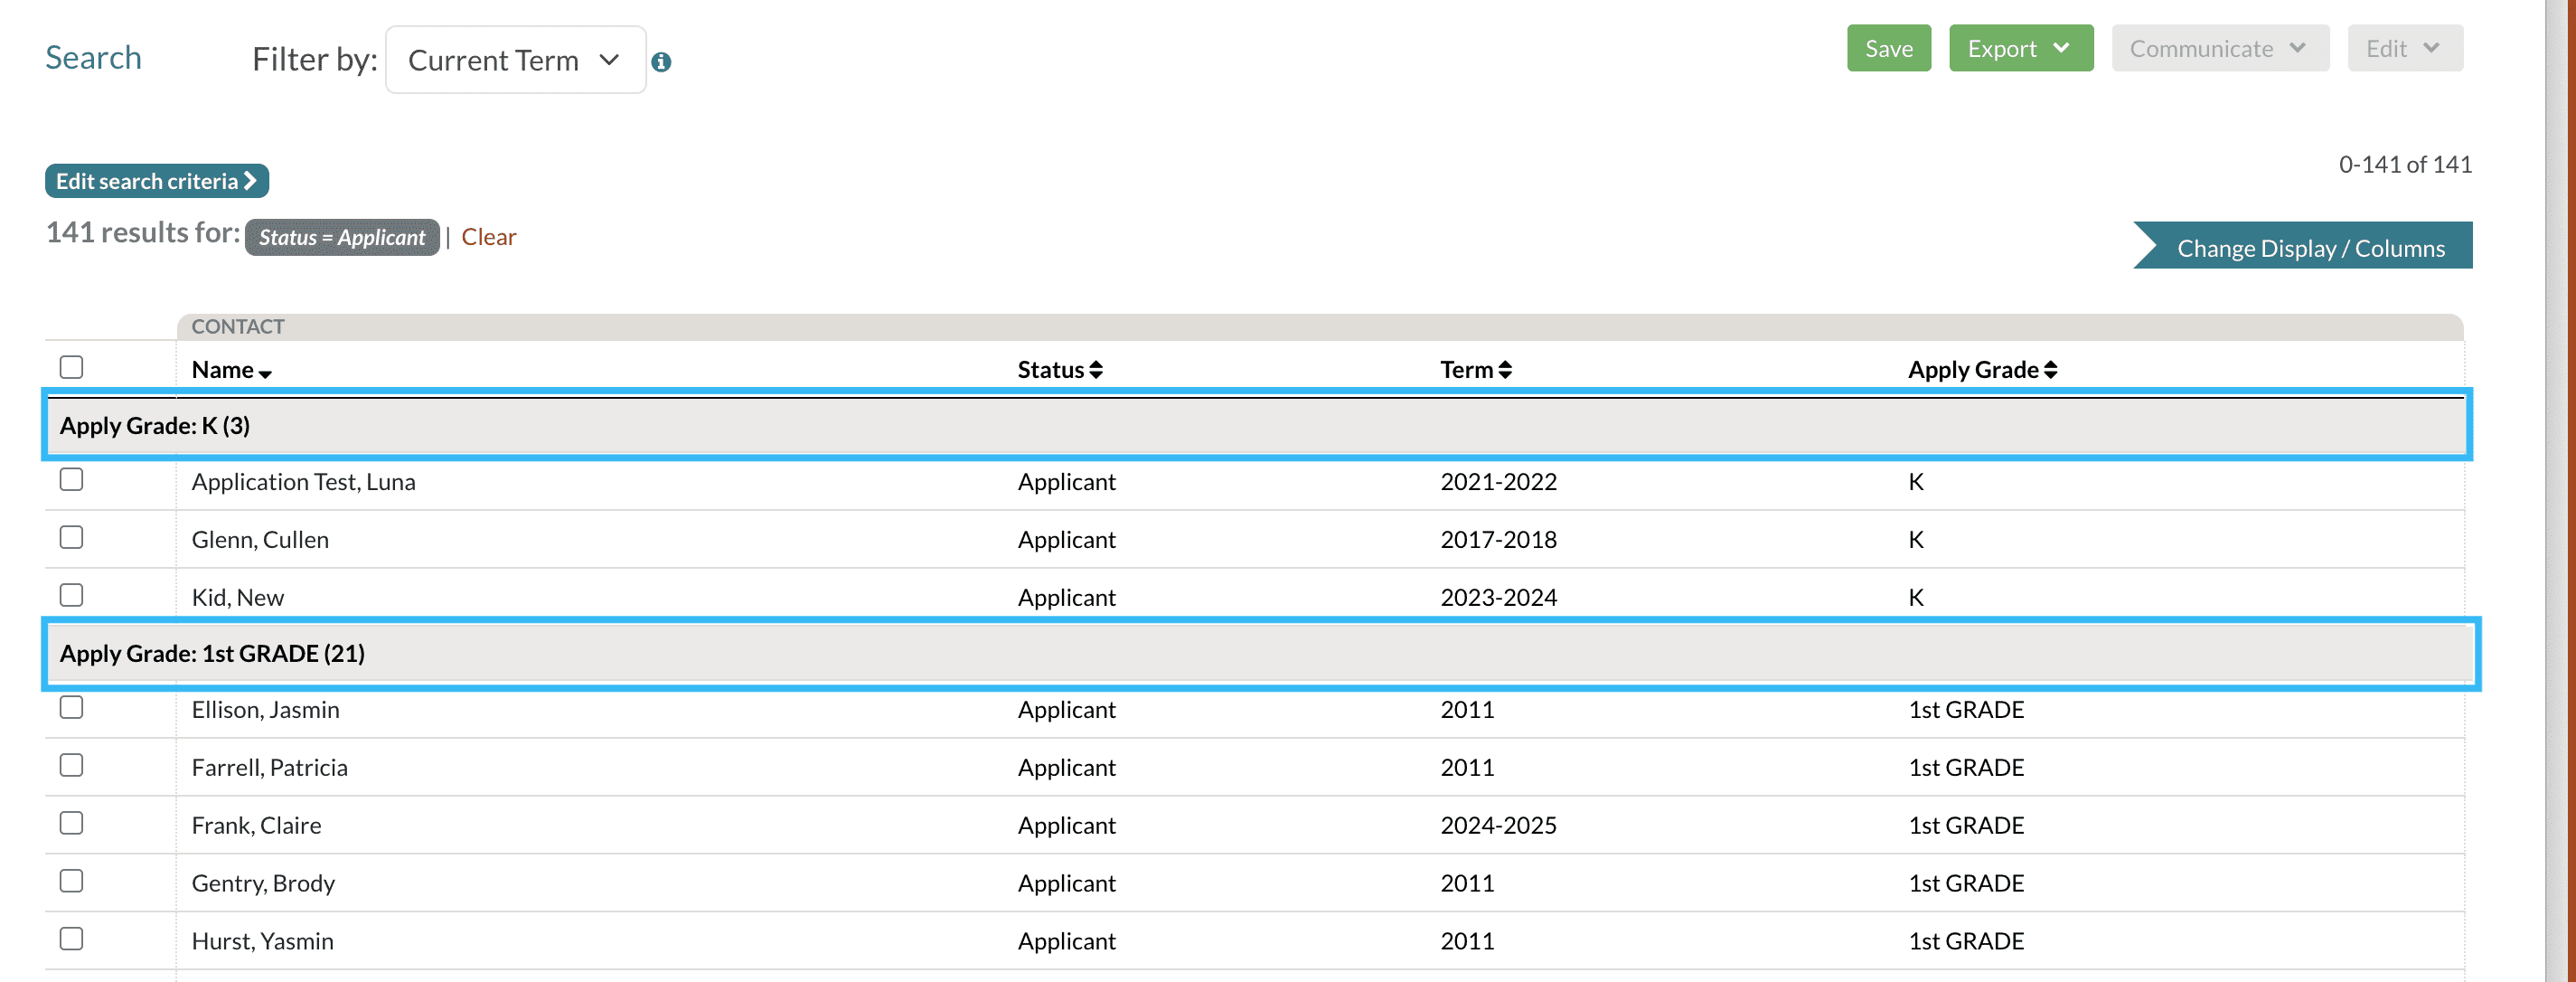
The List with Groupings results display allows you to group the list of contacts in your search by the options of a single field. Some examples include grouping by Grade, Athletic Interests, Current School, or Contract State. Please note: Some field types, such as text fields, cannot be used for grouping.
When you use this option, The field options will display as headers with the associated contacts listed below them, and a total count of contacts per field option will display in the header.
In the example below, the List with Groupings option was used to group the students by grade.
Grouping a search
After opening the Change Display/Columns pop-up window, select the List with Groupings option.
In the Group by dropdown menu, select the field that you'd like to group the search by.
You can also add additional fields to the search and reorder the columns when you use the List with Groupings options. See the Adding columns to a search section to learn how.
Summary Report
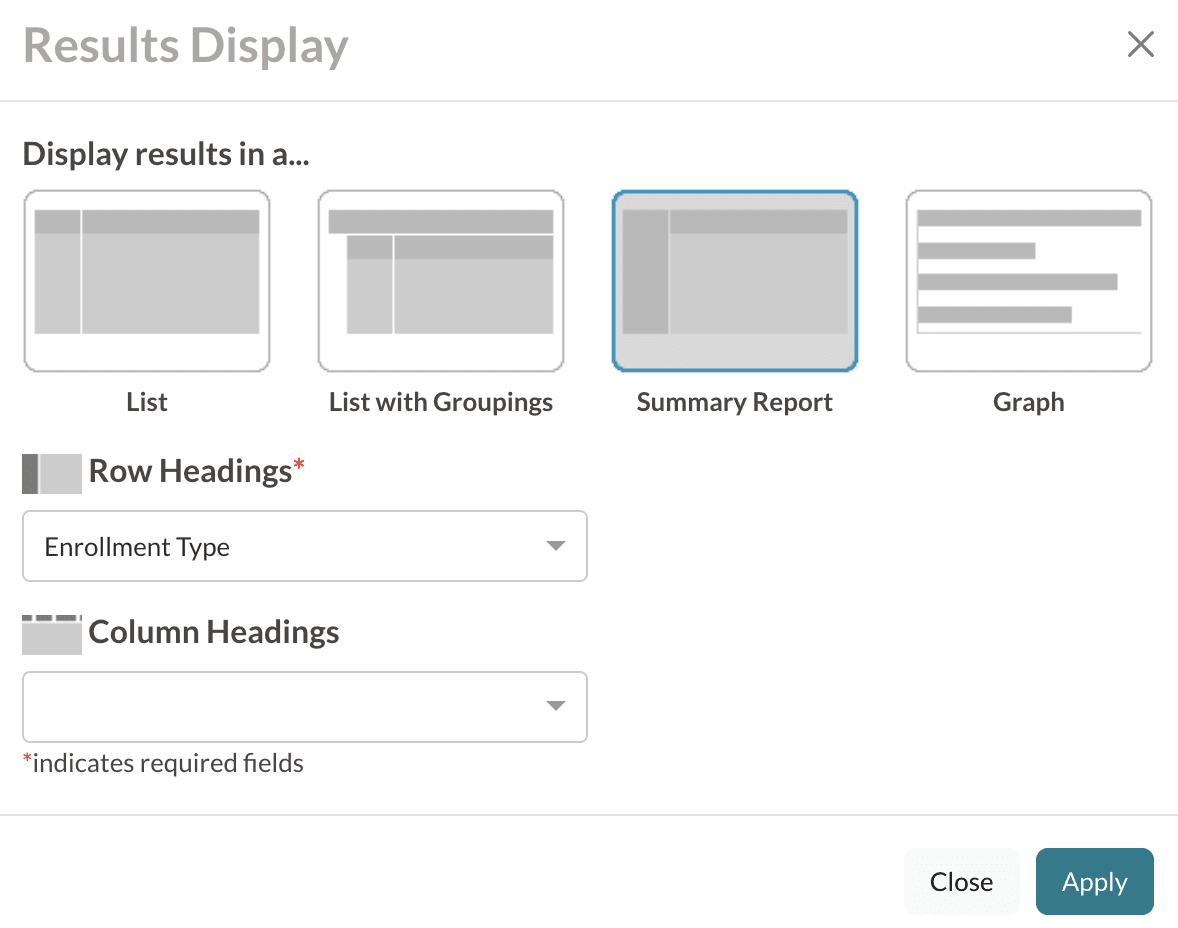
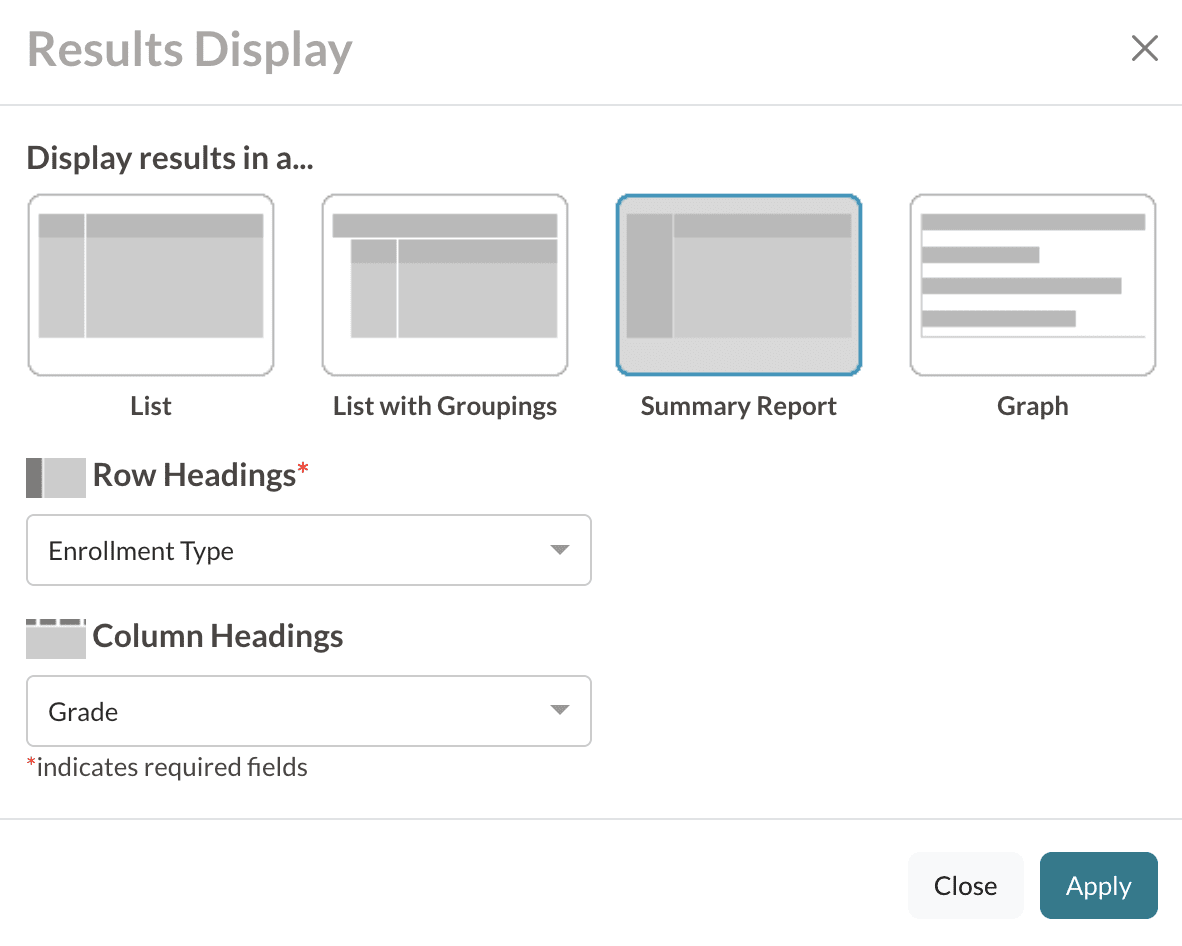
The Summary Report results display shows a total count of contacts meeting one or two criteria (fields). It provides individual counts for each field's options as well as total counts of each field's options across rows and columns. A row heading is required on the summary report, but adding a column heading is optional.
Please note: This is a numerical report and does not display contact names. Below you can see a report when one field is selected and when two fields are selected.
Example using one field (row heading only):
In the Results Display pop-up, only the Row Headings option is used.
Here's what that looks like in the search:
There's an individual count displayed for each enrollment type option along the right of each row and a total count for all contacts with either enrollment type included at the bottom in the total row.
Example using two fields (row heading and column heading):
In the Results Display pop-up, a selection is made for both the Row Headings and Column headings.
Here's what that looks like in a search:
There's an individual count displayed for each contract state and grade and a total count for all contacts with that contract state along the far right. In addition, there are total amounts calculated for each grade and a combination of these totals near the end of the total column.
Graph
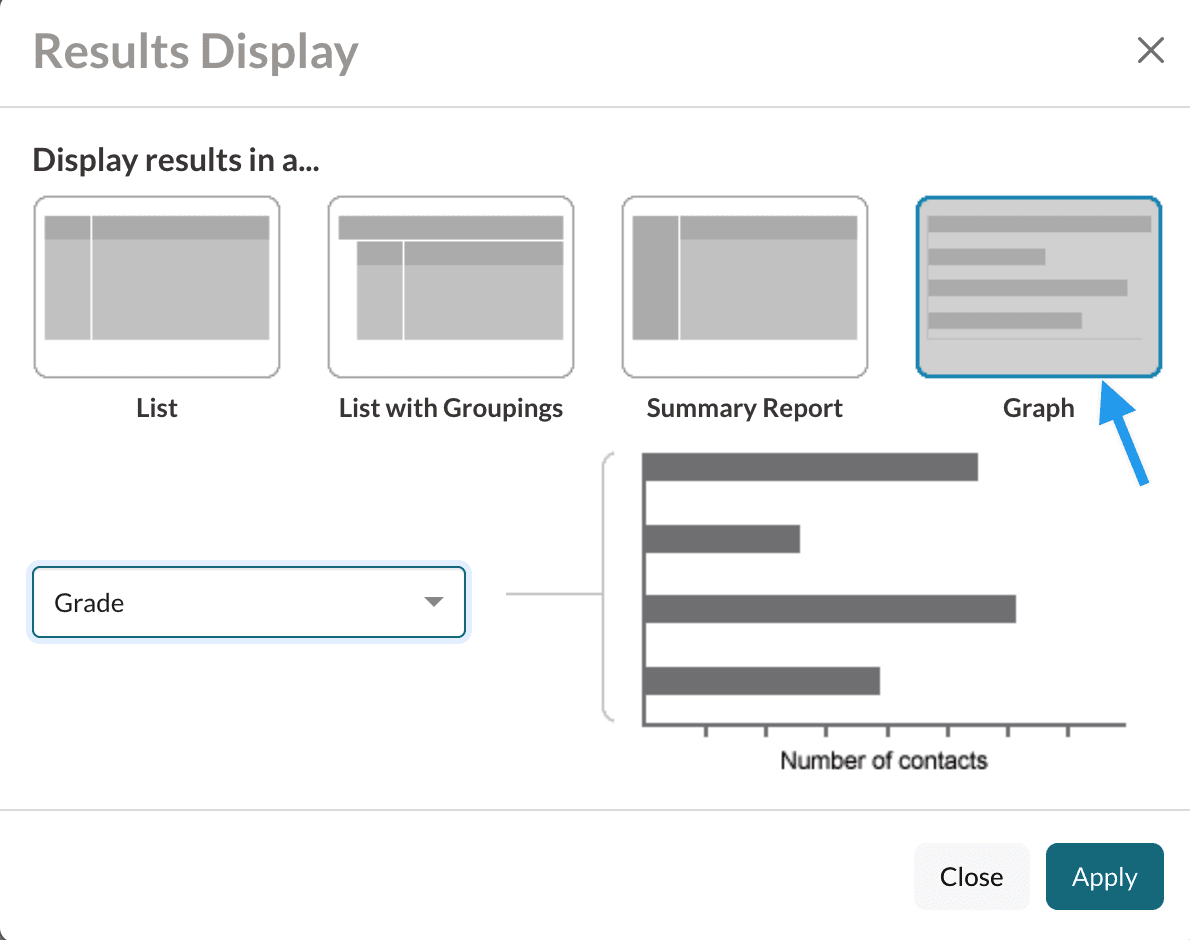
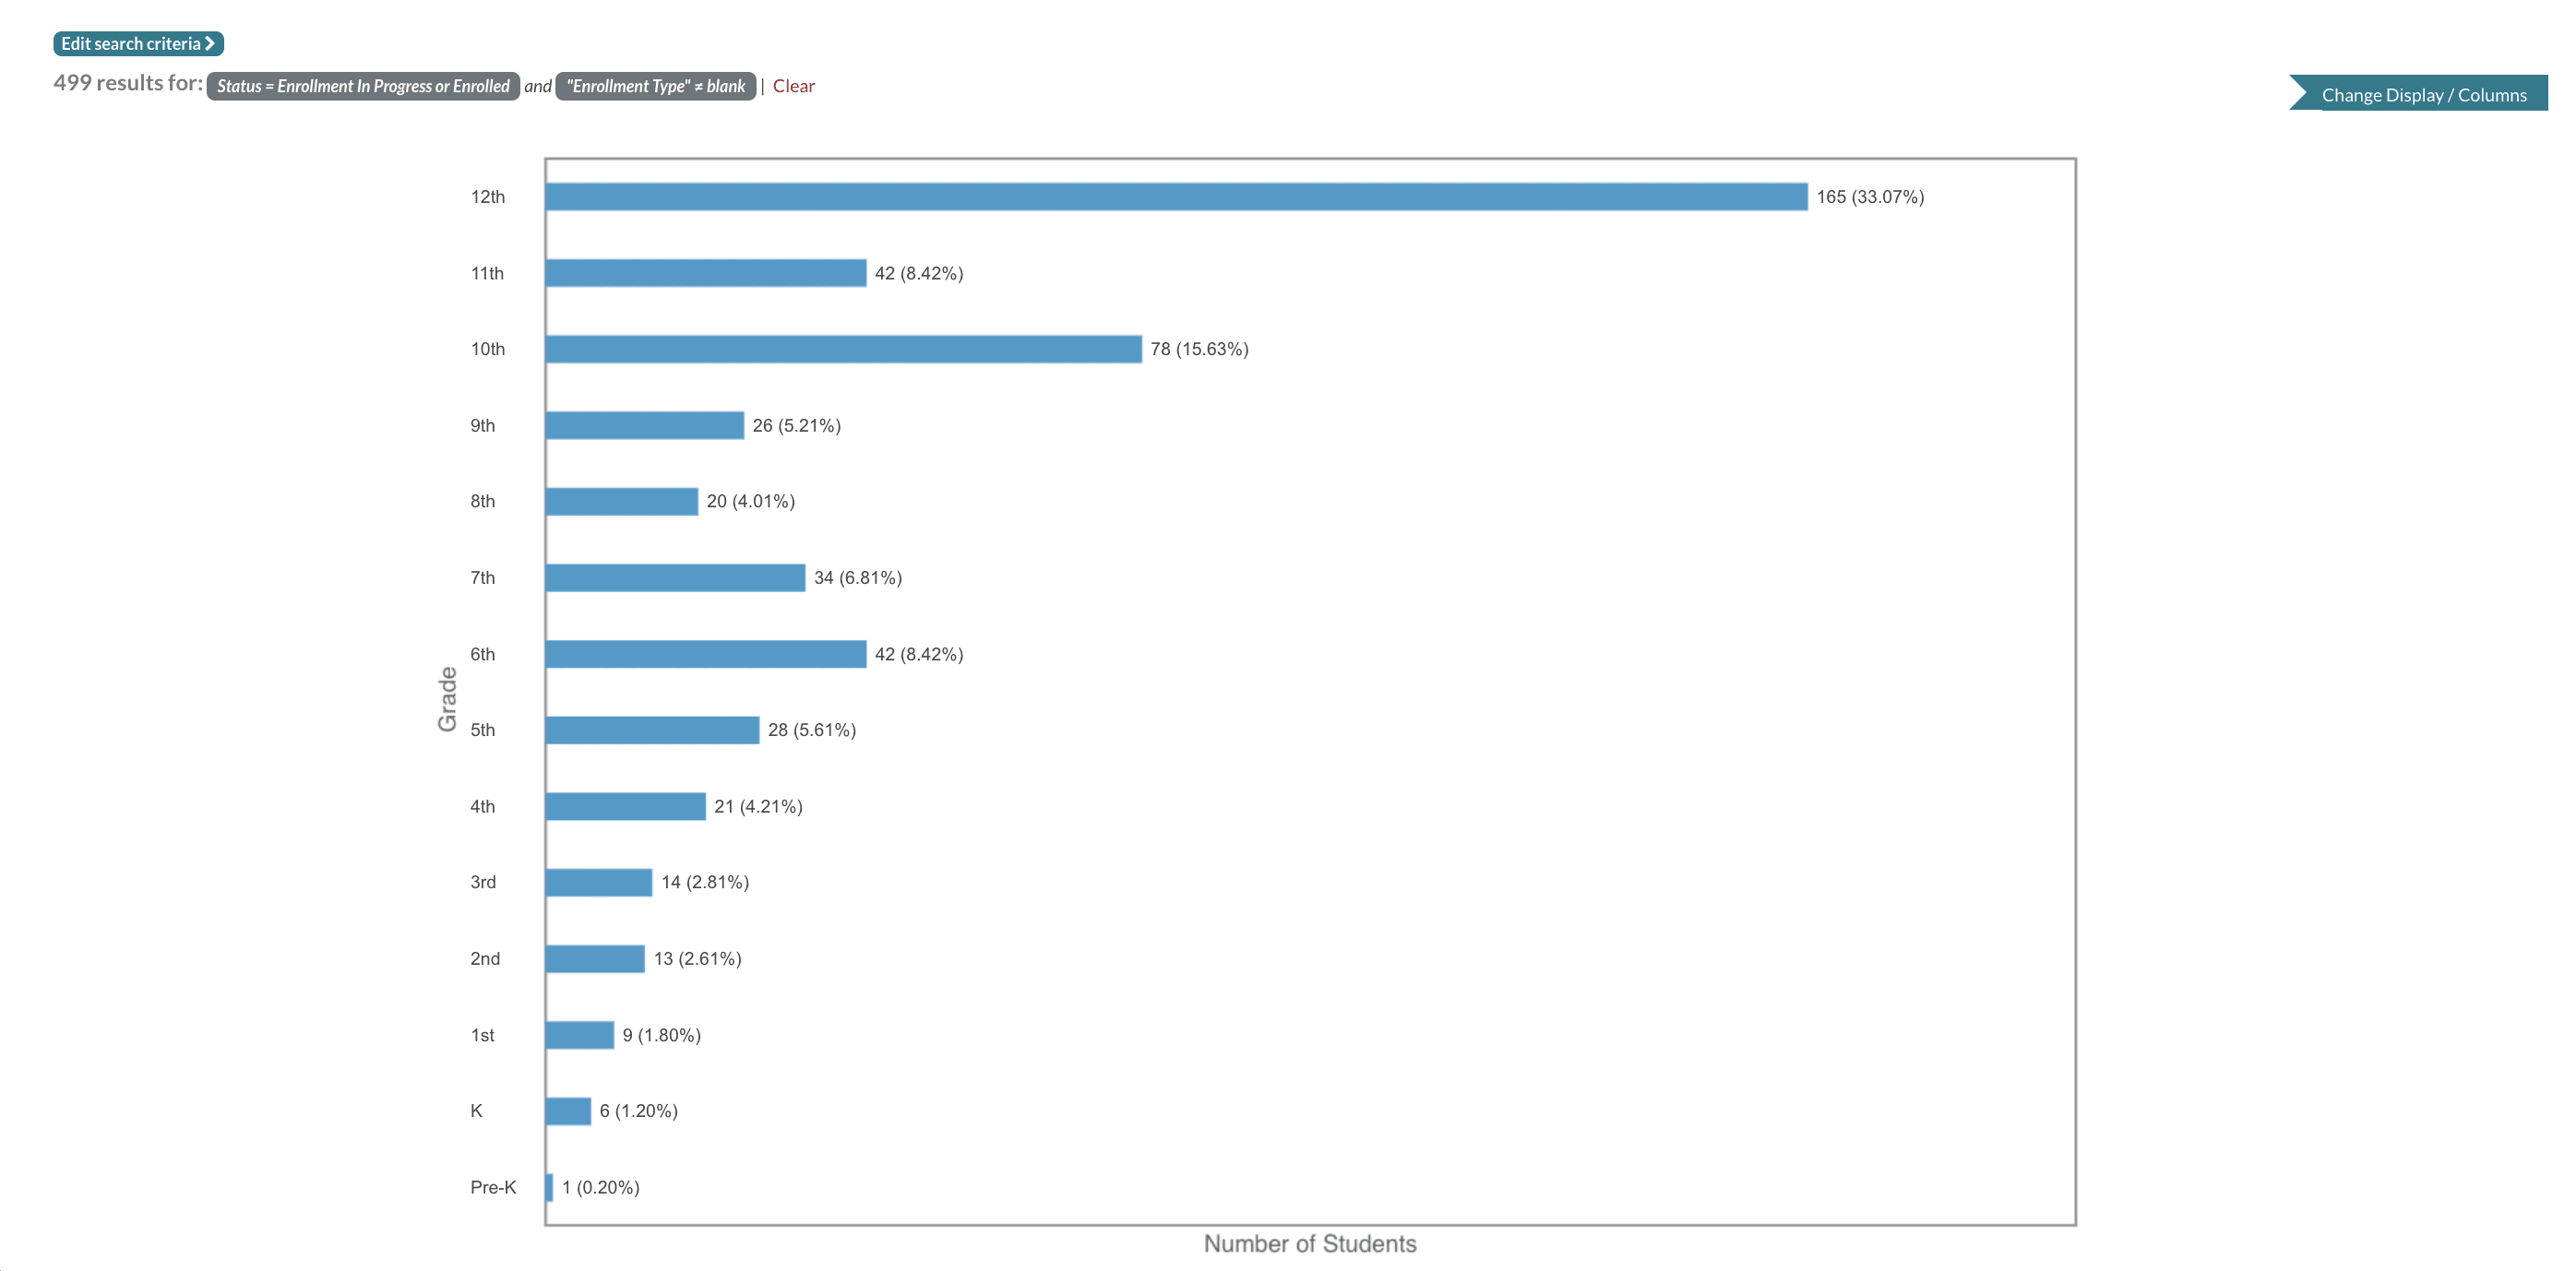
The Graph results display will show you the number of contacts for each option of the field you select. This provides a visual representation of your data, as well as calculated percentage values. This is a numerical report and does not display contact names.
Please note: If there is a long list of options for the field, such as a long current/previous school list, it may not display properly. It is better to use a summary report or list with grouping results display for fields with longer option lists.
Here's what a graph display looks like in the search.





Comments
0 comments
Article is closed for comments.