Overview
Within the supersite, you can view important admissions and enrollment data across all subsites, or schools within your configuration. All reports are located within the 'Search & Reports' tab. These include:
-
Admission Report
-
Enrollment Report
-
Funnel Report
-
Targets & Totals
-
Key Feature Adoption
Continue reading for more information. To learn more about permissions and access to subsites, click here.
Admissions Report
Overview
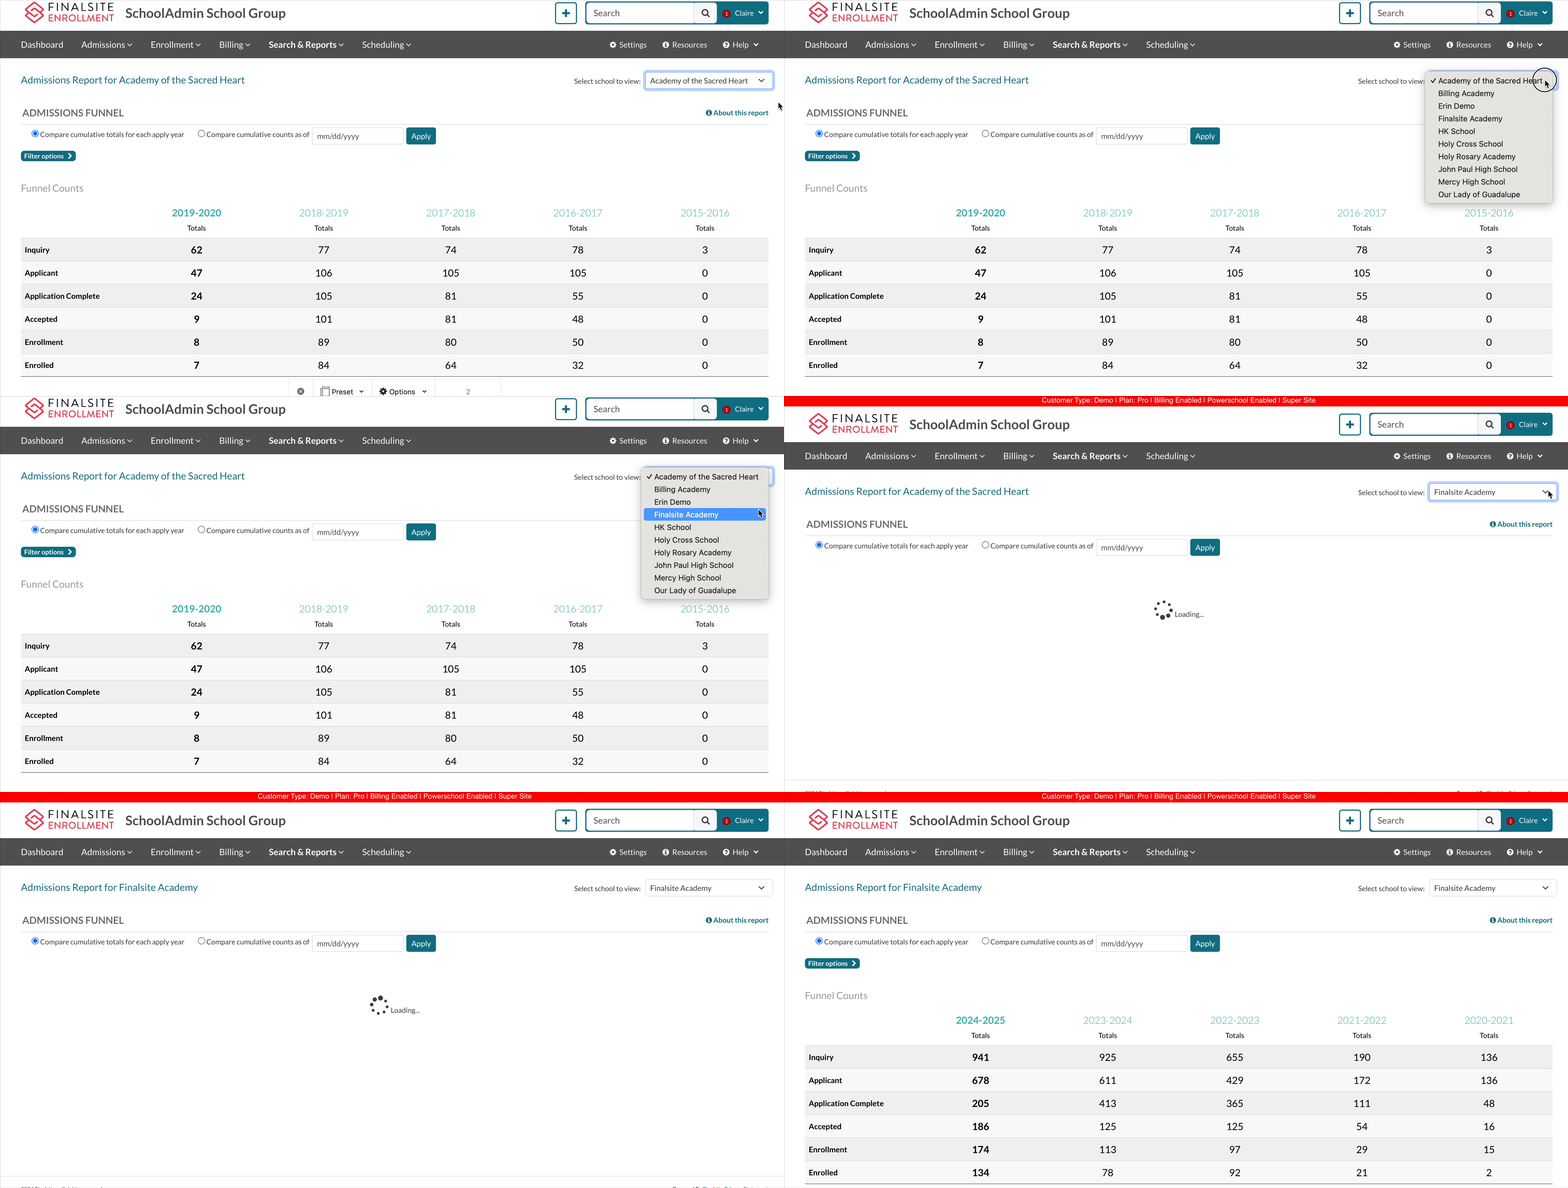
The Admissions Report on the Supersite will populate data for the subsite selected, just as it's displayed on the individual subsite.
Subsite Selection
Select the subsite you'd like to view Admissions data for from the drop-down menu along the top.
To learn more about the data and functionality in this report, click here.
Enrollment Report
Overview
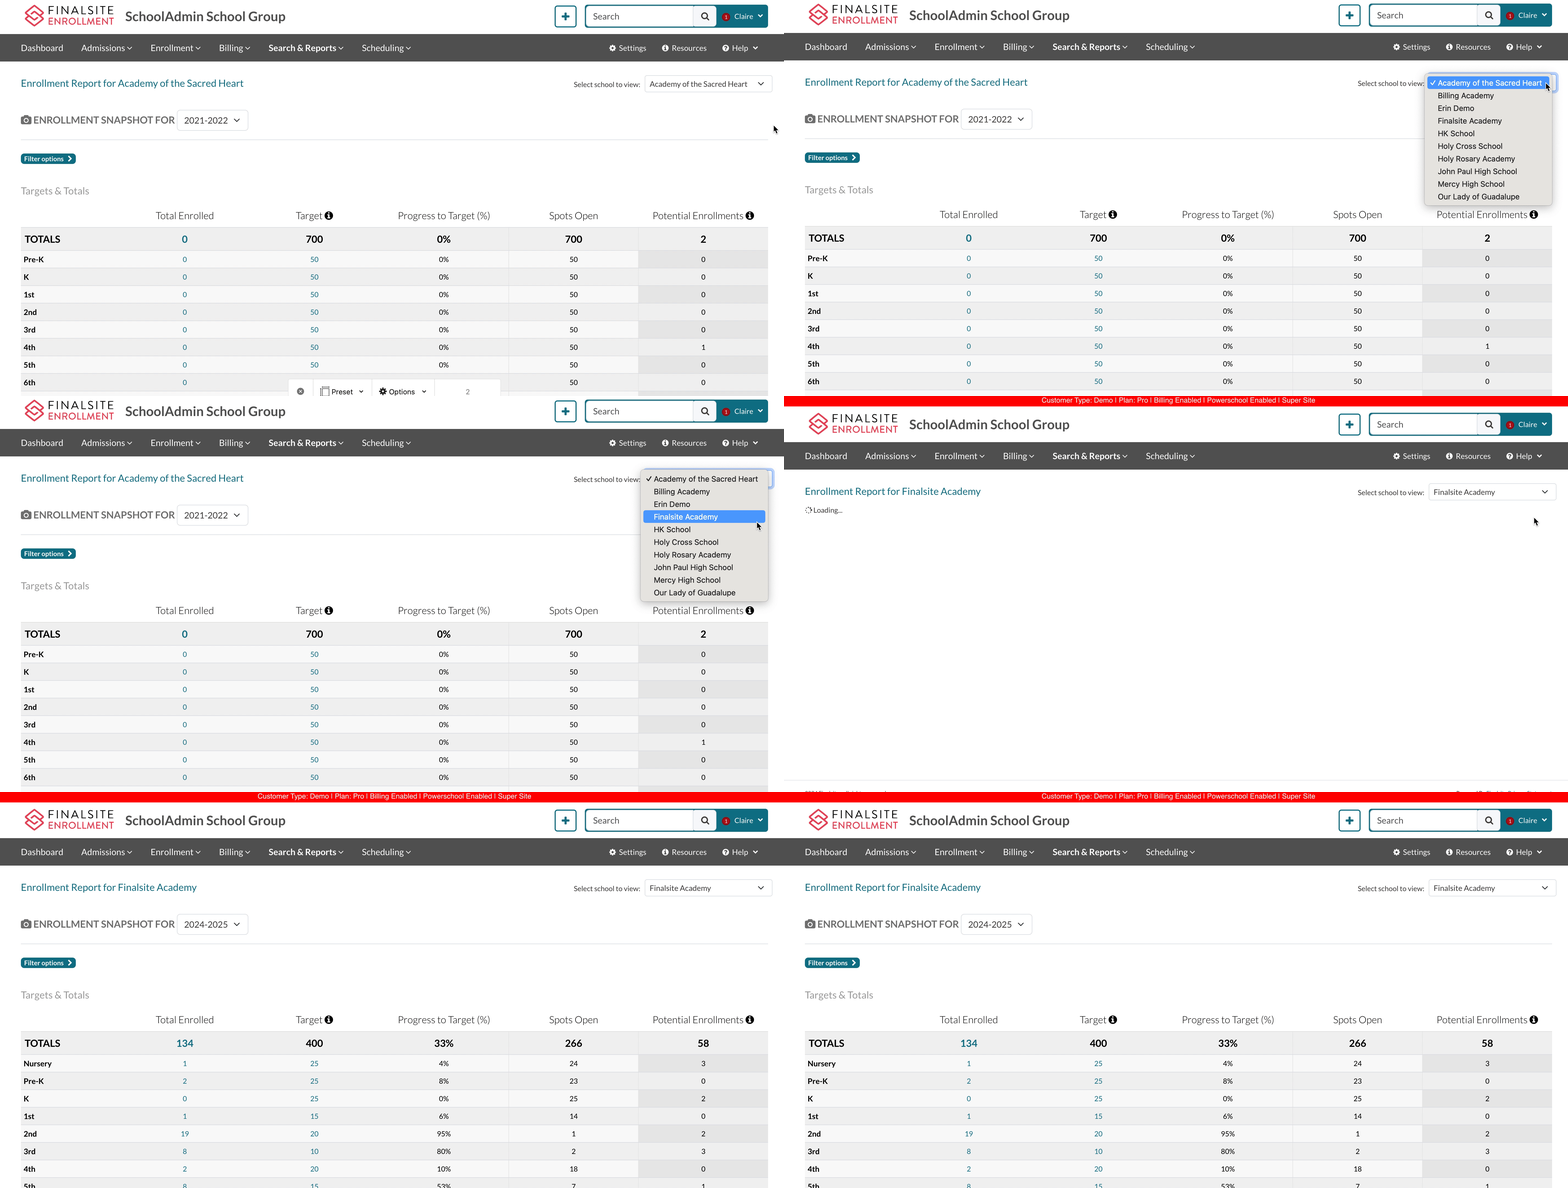
The Enrollment Report on the Supersite will populate data for the subsite selected, just as it's displayed on the individual subsite.
Subsite Selection
Select the subsite you'd like to view Enrollment data for from the drop-down menu along the top.
Target Column Changes
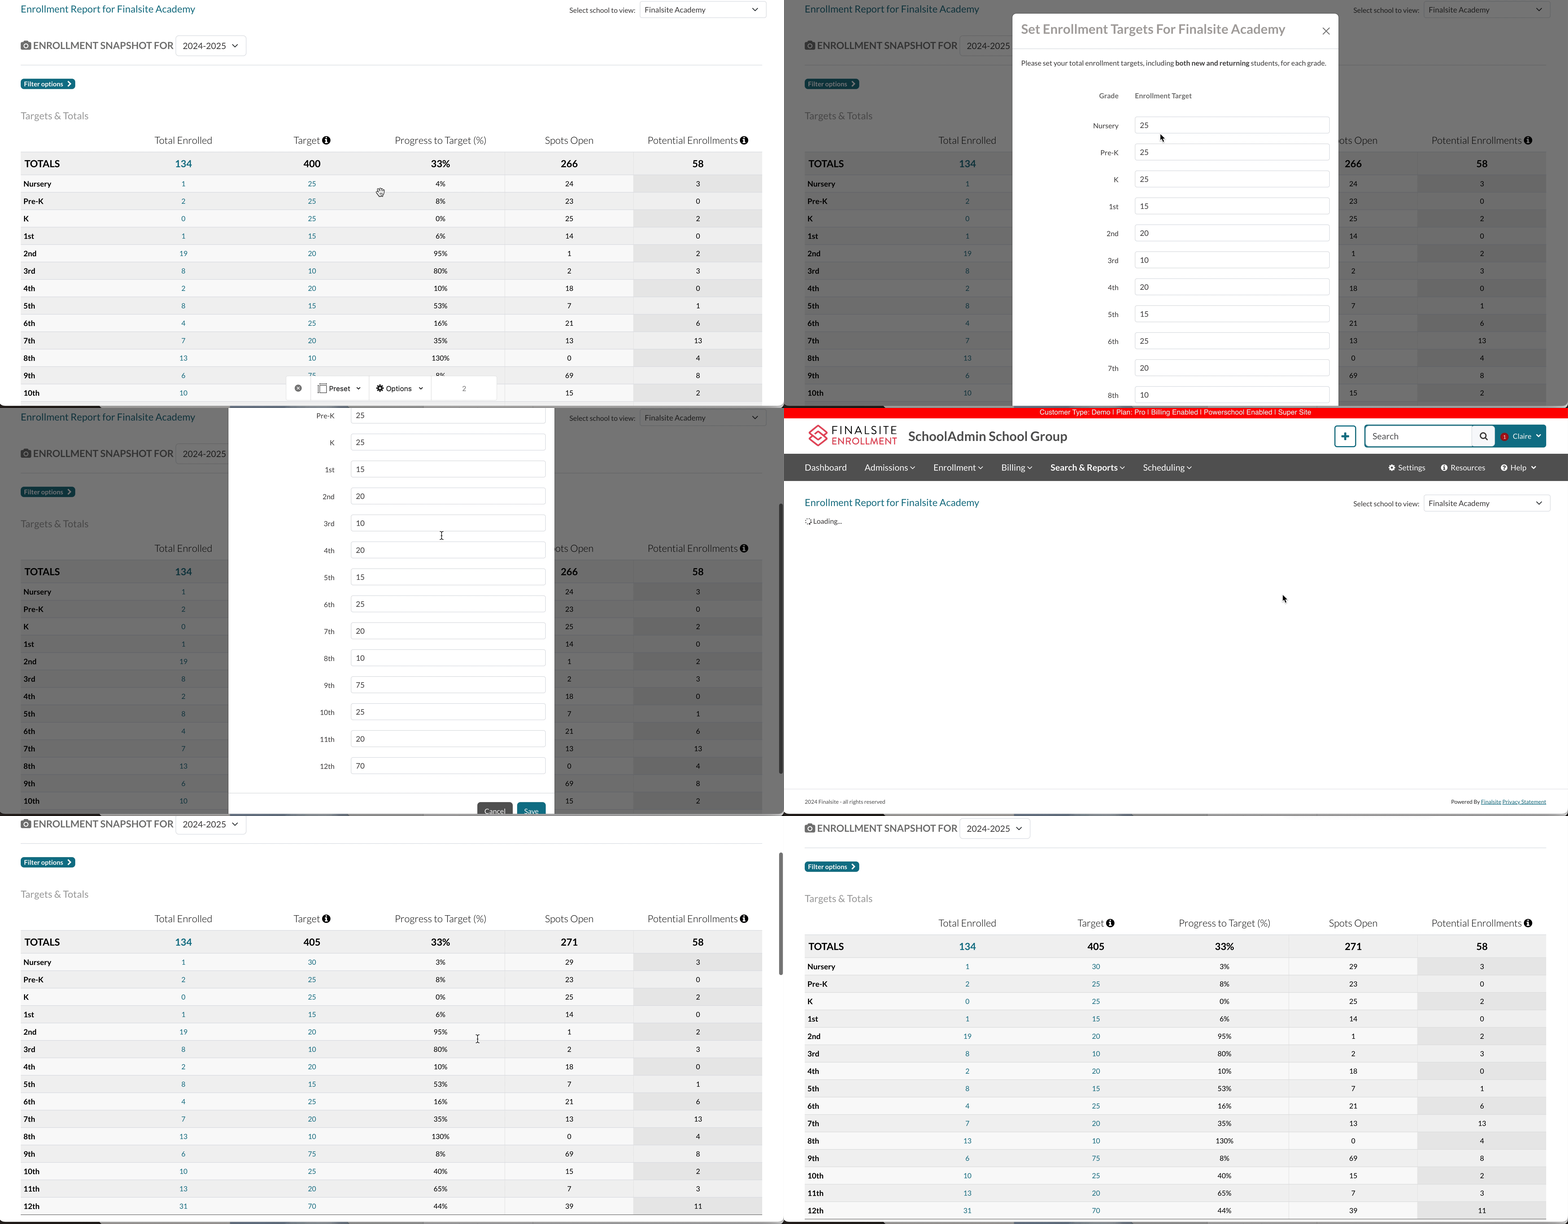
IMPORTANT: Changes made to the Target column in the Supersite Enrollment Report WILL update the targets for the subsite that you're looking at.
The reverse is also true. Any changes made to the target column on a subsite will be reflected in the Supersite report.
To learn more about the data and functionality of this report, click here.
Funnel Report
Overview
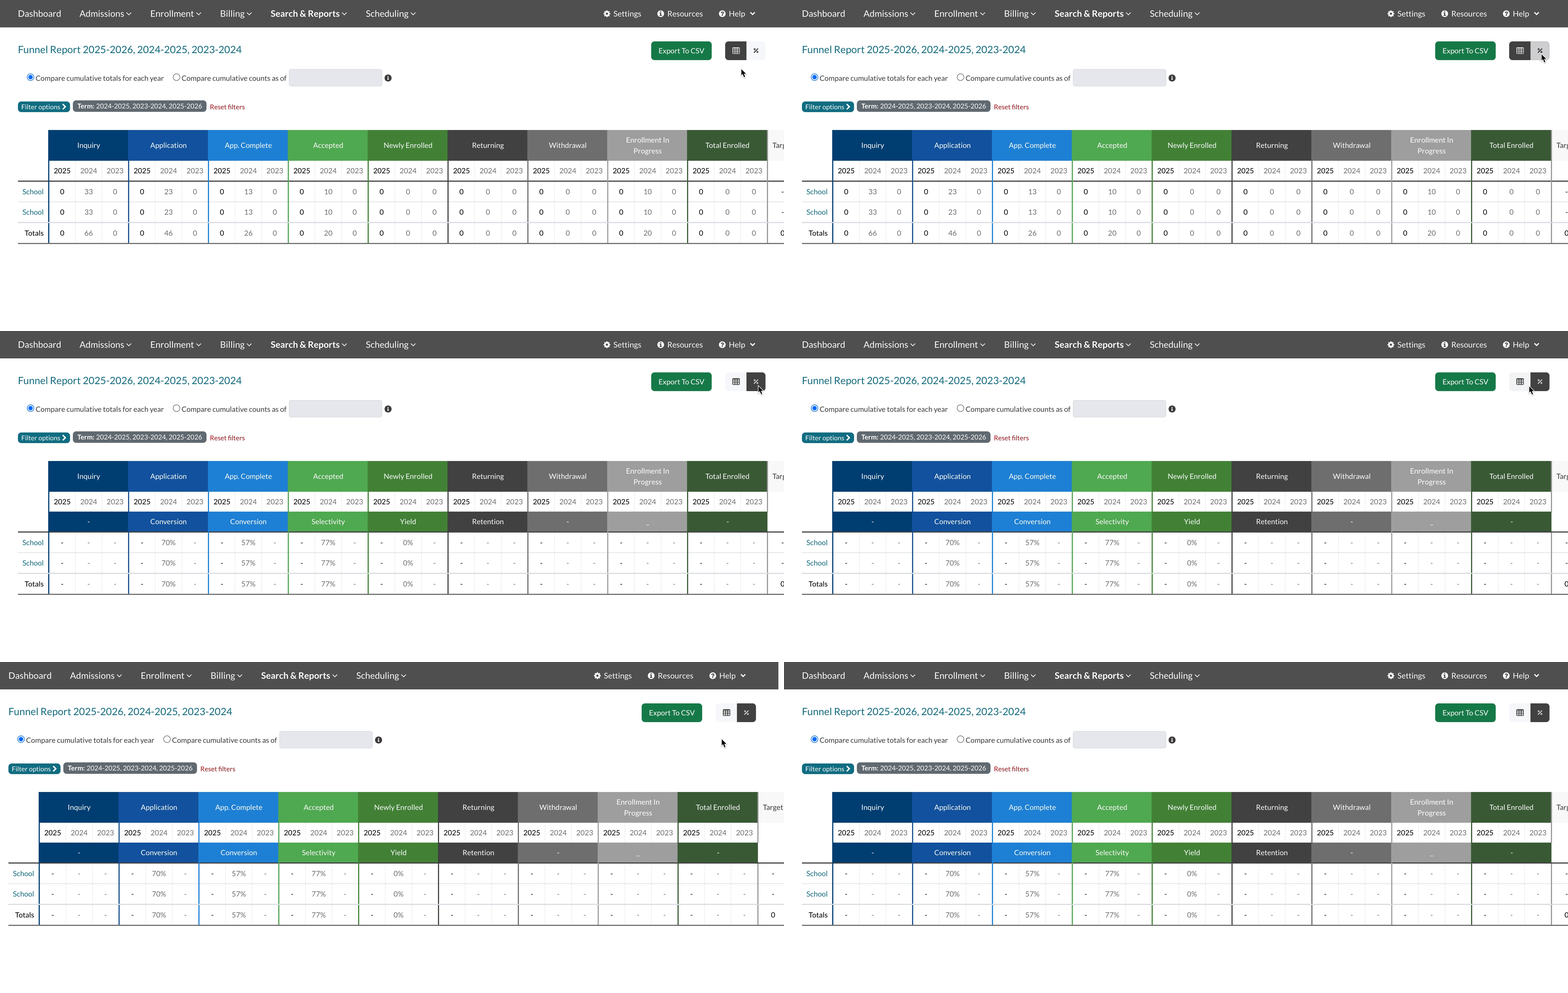
The Funnel Report aggregates and displays admissions funnel data from all subsites so that you can view each school's progress towards their enrollment goals, as well as your total numbers across all schools for each stage of the funnel.
Within this report, you can see the following:
-
School Name: Clicking on the school name will open the Dashboard of the subsite.
-
Current Year Cumulative Totals: You can click on the cumulative total for the current year of each subsite and it will open up in the search & reports page of the subsite.
-
Historical Year Cumulative Totals: For all historical years that are set within filter options, you can view the total counts.
Compare Options
There are two display options:
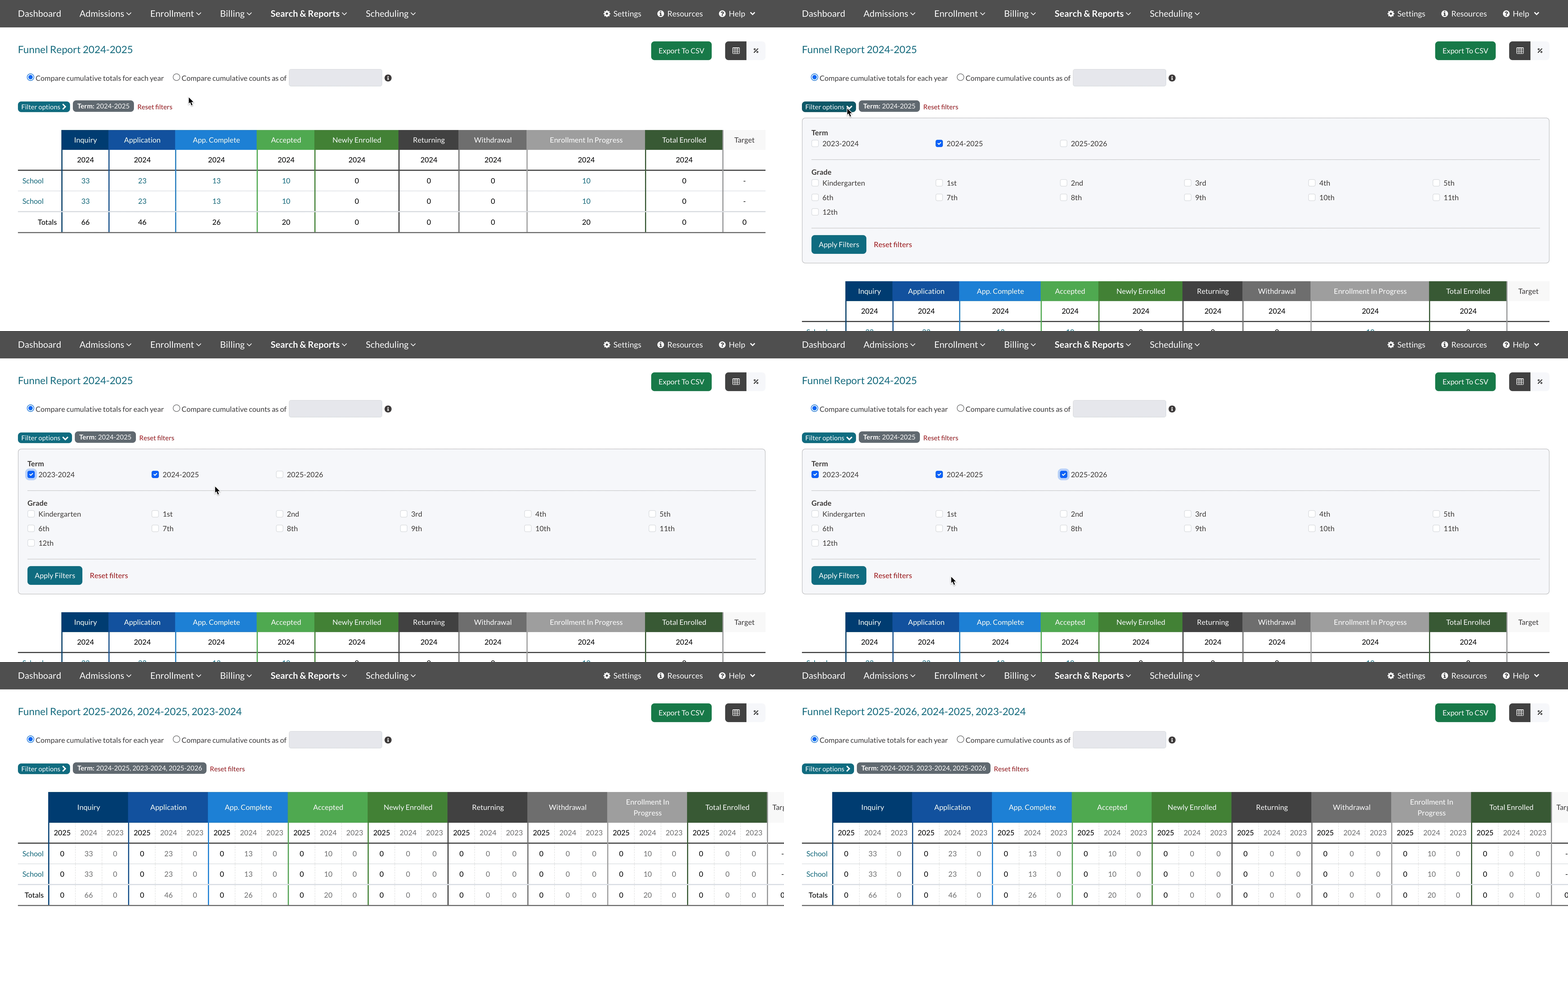
- Compare cumulative totals for each year: The default view compares cumulative totals for each year that are set within the filter options. When filtering by year, the numbers within the table are clickable, allowing you to open a search within that site, listing the student data.
- Compare cumulative counts as of: You can also compare cumulative counts as of a certain custom date. Each historical year will be displayed as of that date in the previous year. When filtering by cumulative counts, the numbers within the table are not clickable.
The Funnel Report can display up to 5 terms at once.
Click on 'Filter Options' to select a minimum of 1 term, and up to a maximum of 5 terms to display. Then select 'Apply Filters' at the bottom of the filter options.
Other Filter Options
In addition to the default filter options, you can set custom filter options so you can report on fields that are most important to your workflows across all subsites. Please contact the Support team for all custom filter option requests. Some examples include religion, previously attended, is parish member, etc.
Please note, that you'll want to pick fields that are used across all schools for data consistency. This means, the field must have the same internal field name across all subsites, for the data to display for all schools.
% Conversion Review
Clicking the percentage sign (%) button in the top right corner switches to a report view that shows conversion, selectivity, yield, and retention percentages for each school as students move through the funnel. Please note, that the Inquiry columns will ALWAYS be blank since conversions don't begin until the Applicant stage.
Export to .CSV
To export the funnel report into a .CSV file, click the Export button at the top of the page. The file will download automatically when it's ready.
Targets & Totals Report
Overview
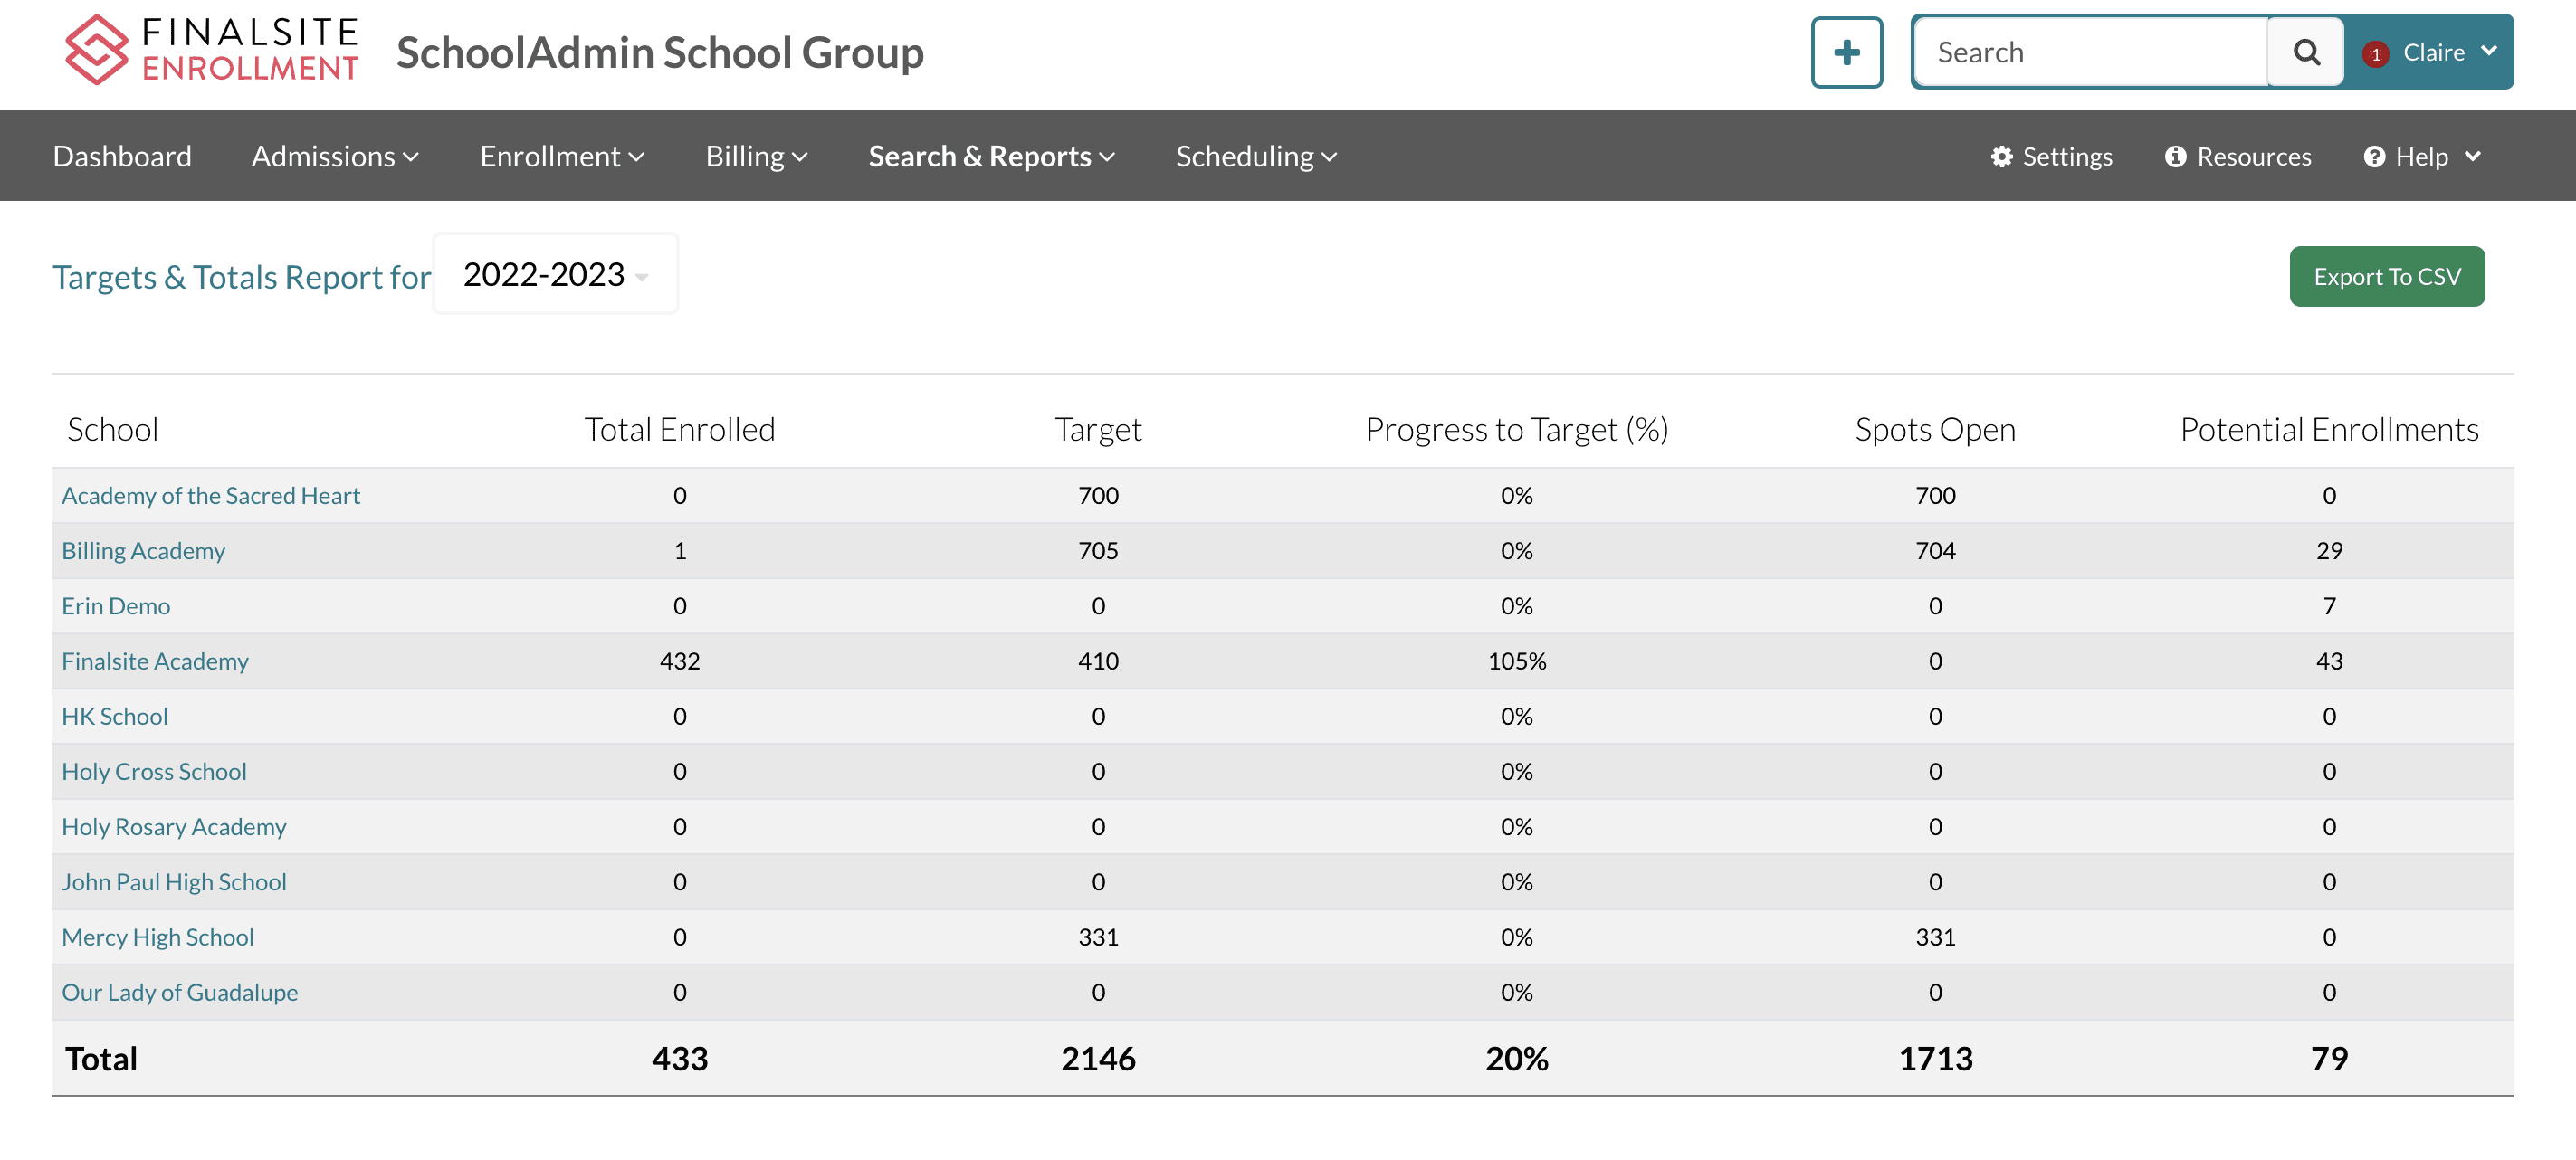
The 'Targets & Totals' report takes the top row of data from the Enrollment Report for each subsite and combines them all into one report. It includes grand totals for each column of data along the bottom row of the report.
Terms Filter
First, select the term you'd like to view targets and totals for across all subsites from the drop-down at the top of the page.
Columns
The first column in this report is the 'School Name.' Clicking on the school name will open the full Enrollment Report on the subsite.
The following columns of data will be populated for all subsites:
- Total Enrolled: Displays the total number of enrolled students, both returning and new, by grade level. You can click any of the numbers in this column to pull up a list of those students in
- Search & Reports - from here, you can perform bulk actions, export the data, or create a saved search.
- Target: Displays the target number of students you want to enroll for each grade level. This value includes both new and returning students. You can click on any of these numbers to set your target values - see the section below for more information.
- Progress to Target (%): Tracks your progress to achieving your set target numbers in a percentage amount.
- Spots Open: Displays the total number of enrollment spots left open for each grade level.
- Potential Enrollments: Total number of students that could still potentially enroll for each grade level. This information is broken down in more detail within the Potential Enrollment Details snapshot below.
Export to .CSV
Along the top of the page, you can also export this report to .CSV
Key Feature Adoption Report
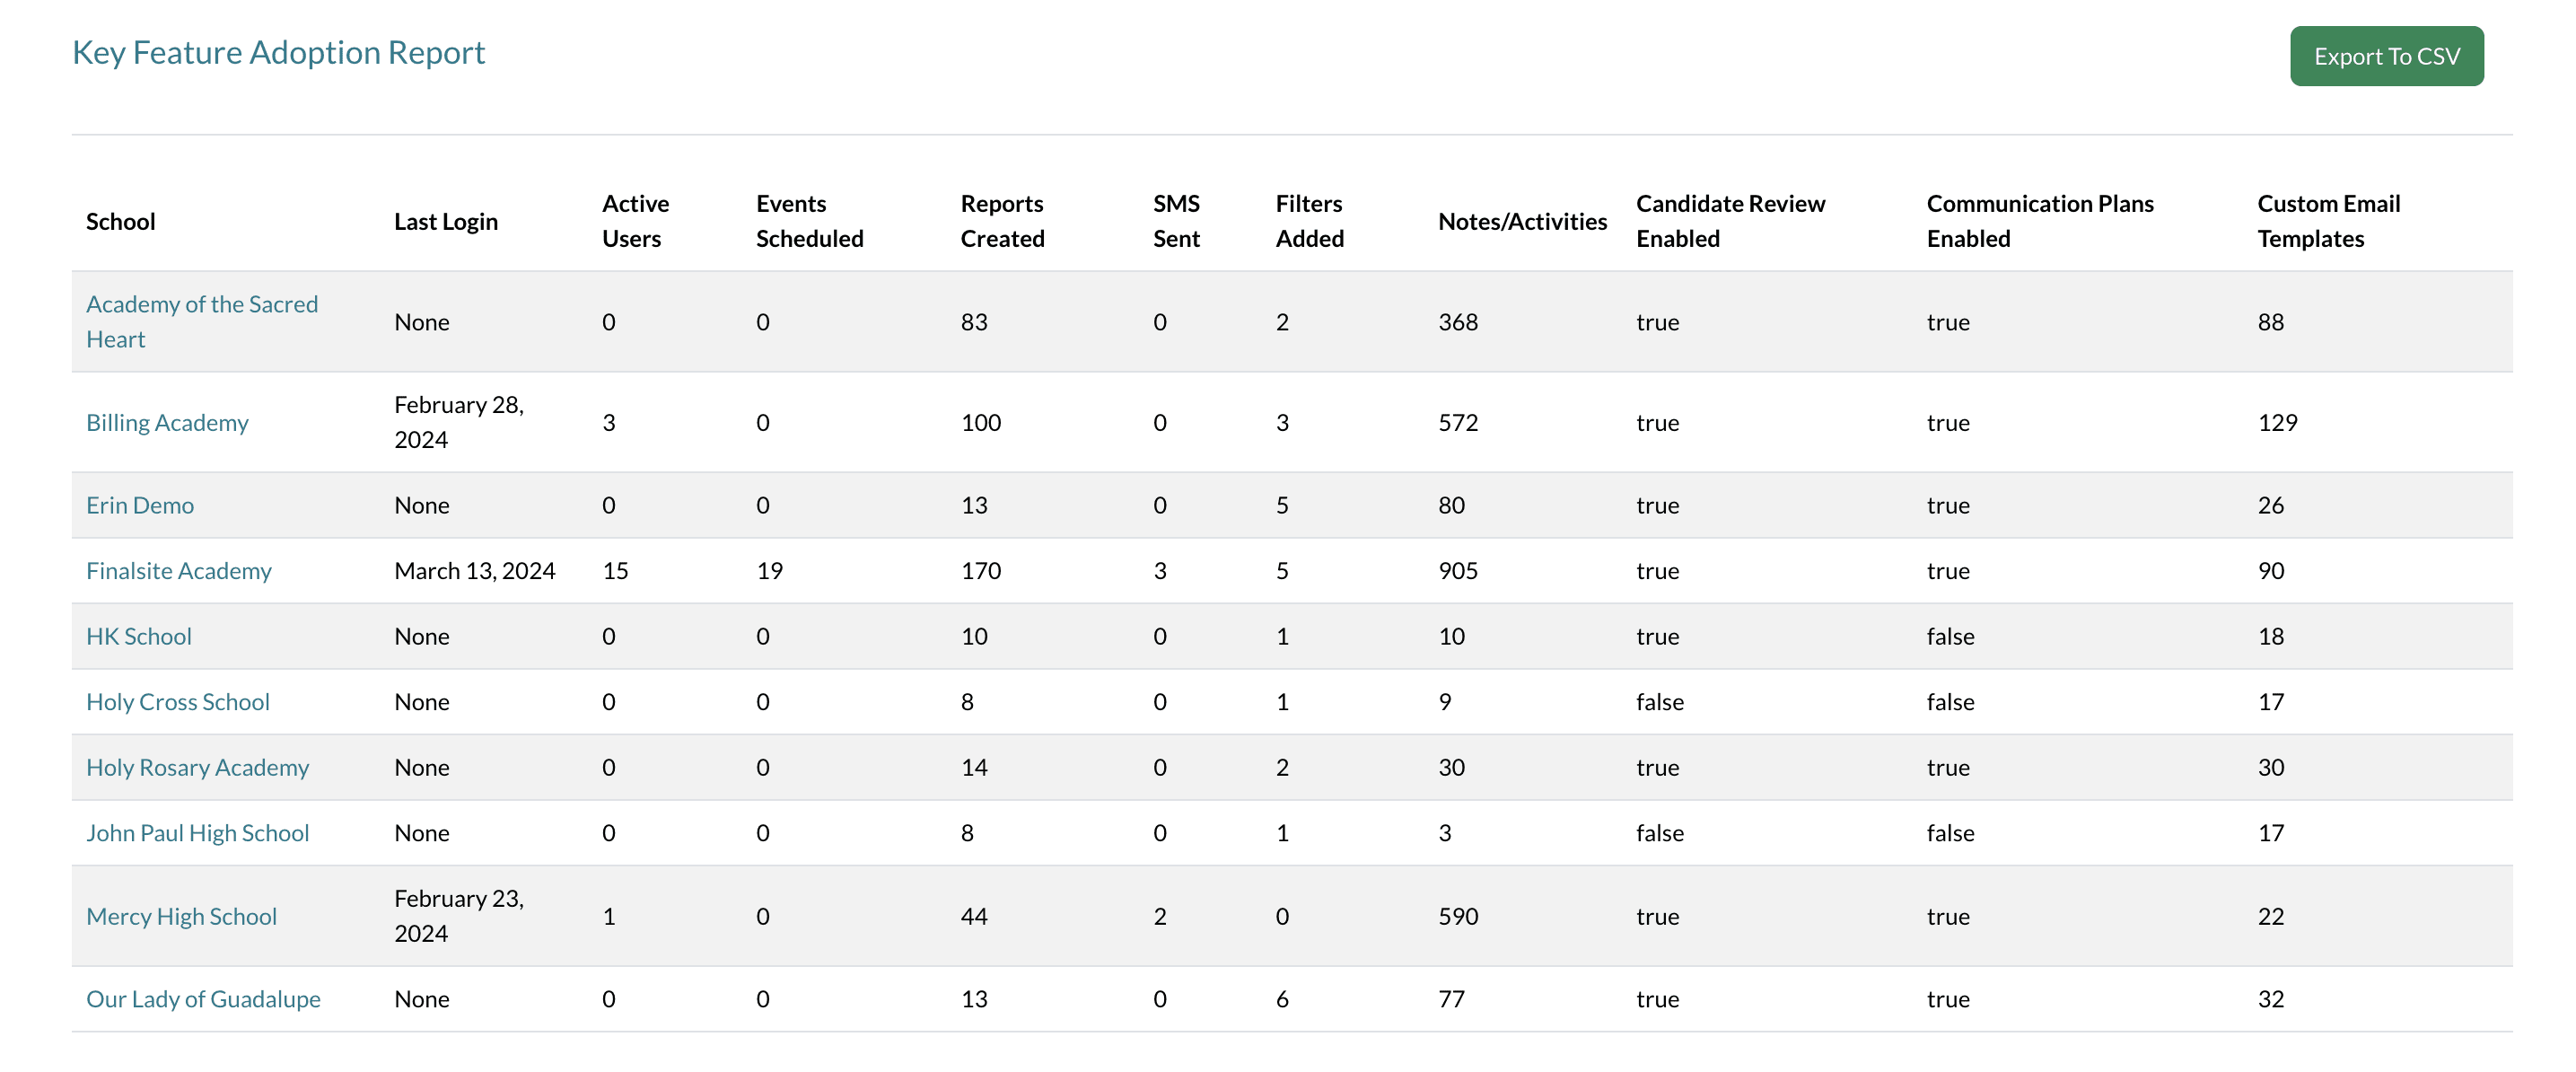
The 'Key Feature Adoption' Report displays what major features are being used by each subsite/school so that you can see the 'performance' of each school and identify what features are being used the most by each school, and which ones haven't been adopted yet. This is critical to the success of each school, as the more features that are being utilized, the more streamlined, personalized, and automated each school's workflows will be.
Columns
The first column in this report is the 'School Name.' Clicking on the school name will open the subsite.
The following columns of data will be populated for all subsites:
-
Last Login: The time and date that the last System Admin/Admin/User logged into the system.
-
Active Users: The number of System Admins/Admins/Users/Limited Users that are actively logging in.
-
Events Scheduled: The total number of registrants for all events set up in the subsite.
-
Reports Created: The number of saved reports that were created within the Search & Reports tab.
-
SMS Sent: The total number of text messages sent within the subsite.
-
Filters Added: The number of custom filters that display within the 'Filter Options' of any listing page in the subsite.
-
Notes/Activities: The total number of Notes and Activities across all contact records in the subsite.
-
Candidates Review Enabled: If 'true,' the school has at least turned the review module on, however, they may or may not be using it. A best practice is to check the subsite and see if there are applicants on the 'Candidates in Review' list page.
-
Communication Plans Enabled: If 'true,' the school has created at least one communication plan within Settings-->Communication-->Communication Plan.
-
Custom Email Templates: The number of custom-created email templates within Settings-->Communication-->Email Templates-->Custom Emails
Export to .CSV
Along the top of the page, you can also export this report to .CSV




Comments
0 comments
Article is closed for comments.